Although suicide is a leading—and rising—cause of death in the United States, efforts to increase awareness of it have failed. Campaigns such as Race for the Cure® for breast cancer, for one, attract 10 times as many participants as do the Out of the Darkness suicide prevention walks, despite the fact that annual U.S. death counts for breast cancer and suicide are nearly identical. There are also more than twice as many suicides as homicides and suicides outpace homicides at every age starting in the early teens, but homicides receive a comparatively overwhelming majority of press.
Of the 10 leading causes of death in the U.S., only suicide death rates are currently increasing.1 Rates have been climbing steadily for more than a decade, and in 2013 (the latest year for which statistics are available) the rate was 21 percent higher than in 2000. Estimates of suicide’s annual financial costs in the U.S. indicate lost wages and productivity of $44 billion stemming from suicide deaths and another $6.3 billion for suicide attempts.2
This article examines some of suicide’s impact on the U.S. life insurance industry, and also briefly looks at current practices and thoughts regarding suicide prevention.
Suicide Rates and Trends
Suicide impacts millions of families in the U.S. as well as world-wide. And its impact is not limited to death: For every death by suicide it is estimated that 20 times as many people worldwide are injured but do not die in suicide attempts3—attempts that too often result in disability or permanent impairment.
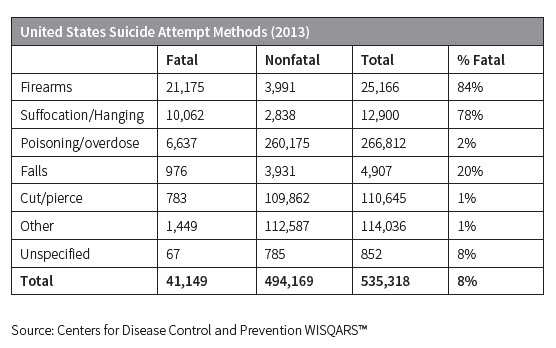
People who choose highly lethal means of suicide such as fire-arms, suffocation or hanging, have, not surprisingly, correspondingly high fatality rates, yet comprise just 7 percent of all who attempt suicide. The overwhelming majority of suicides are at-tempted using poison or deliberate overdose, but only 2 percent of those attempts prove fatal.
The following table shows 2013 fatality rates for several suicide methods in the U.S.
While suicide mortality is generally found to be lower for the insured population than for the general population, the ratio of the suicide rate by insureds compared to that for the total population increased dramatically at the peak of the most recent recession.
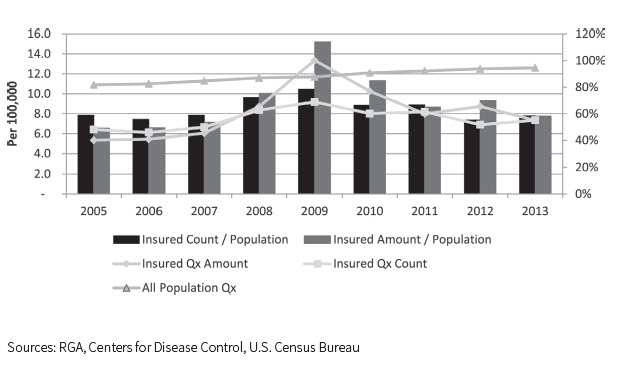
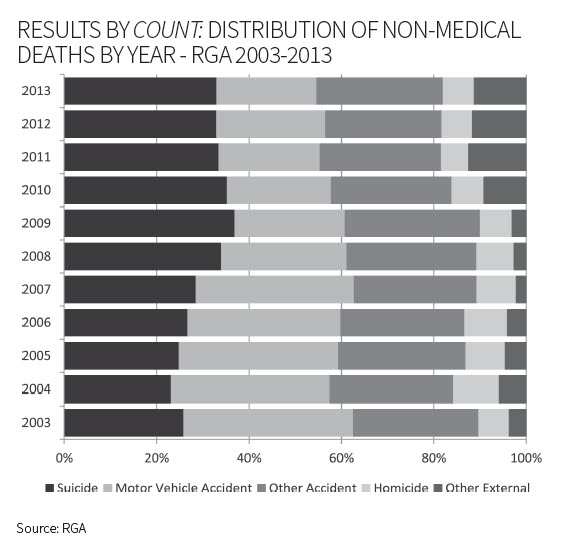
After the financial crisis of 2008 and during the ensuing recession, suicide became the most common non-medical cause of death for the insured population. Alarmingly, the numbers have not receded back to pre-recession levels:
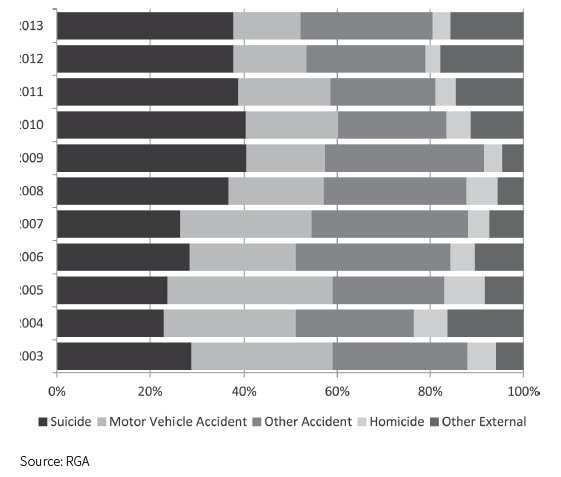
Results by Amount: Distribution of Non-Medical Deaths By Year-RGA 2003-2013
Face amount bands further inform the discussion:
- Suicide percentages relative to total causes of death typically increase with face amount once the bands climb past $50,000.
- Policies with face amounts above $1 million had the largest increase in suicide rates during the period following the 2008 economic recession.
- Average claim sizes also increased following the recession. Average claim size is historically larger for suicide claims as a cohort than for all other (non-suicide) claims, and the gap is now even wider.
Unlike the consistently increasing pattern of population suicide rates, insured suicide rates exhibit greater variability as well as a more active response to economic conditions.
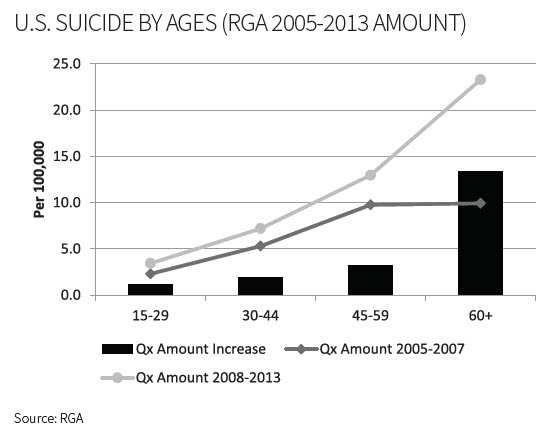
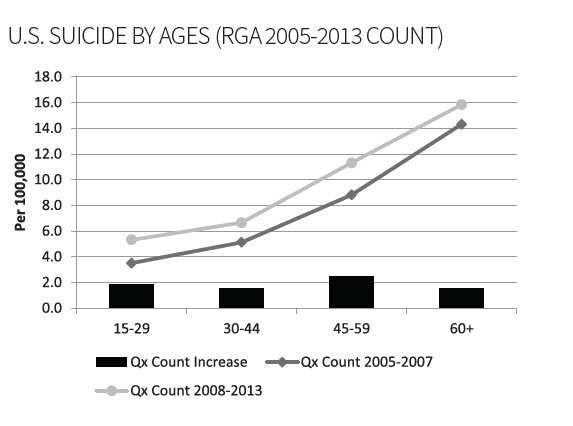
The following charts compare insured suicide rates prior to the recession to those since 2008 (considered the start of the recession). The rate of suicide by amount for individuals ages 60+ has increased to more than double the 2005–2007 rate.
Timing and Contestability
Insurance policies in the U.S. typically have suicide exclusions for the first two policy years. Given that those who die by suicide often plan for it in a concrete manner, one might expect the suicide rate to increase after the contestability period ends. This conclusion is borne out by the evidence in Figure 7 (below) in no uncertain terms:
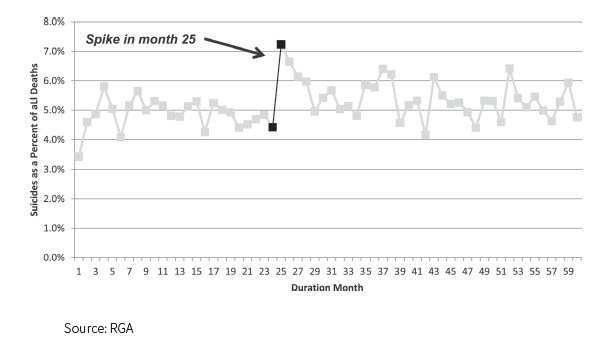
As is clear from the graph above, suicides spike immediately after the contestability period ends and continue to remain elevated, although that first month shows the largest impact. From 2009 through 2013, approximately 5 percent of all paid claims by amount went to beneficiaries of suicide deaths beyond the contestability period.
For some of these individuals, the plan to commit suicide after the contestability period might have been their primary motivation for remaining alive until that point.4
Prevention and Demographics at Risk
Suicide prevention begins by understanding which individuals are mostly likely to be at risk. For the susceptible, suicide be-comes an option when their pain (whether physical or psycho-logical) is greater than their resources to cope with that pain. Societal determinants can include childhood abuse and a lack of current social supports. Clinical factors can include psychiric dimensions (PTSD, substance abuse/addiction, depression, anxiety), physical symptoms (pain and insomnia), and thoughts (suicidal ideation/planning, feelings of hopelessness and/or despair). Studies have shown that more than 90 percent of people who commit suicide have underlying mental illness.5 Economic stressors such as unemployment have also been shown to con-tribute to suicide rates.6 Additionally, certain neurocognitive factors can play a role, though it should be noted that these factors are not specific to suicide.
Demographics of the at-risk population also merit attention. Biomarker evidence indicates that suicidal behavior is partly heritable. Interestingly, all individuals who have accessed health care in the last 30 days are at higher risk for suicide. Young-er women are statistically more likely to attempt suicide than are younger men, but that gap decreases with age. Additionally, western U.S. states have much higher suicide rates than do eastern states.7
Life insurance underwriting may help identify individuals who might be higher suicide risks. In an internal review of causes of death by known impairment, individuals rated for any type of mental disorder were 2.5 times more likely to die by suicide than were very closely matched individuals without a mental illness impairment.
Many suicides are preventable. Recent research has uncovered several actions and initiatives that could potentially generate significant reductions in the current suicide rate:7
- Psychotherapy is a proven effective treatment and can be used in hospital emergency departments.
- Healthy connectedness and the existence of social support are important for suicide prevention. These need not be overly personal: a study observing the effect of “caring contact” postcards as a means to follow up with some at-risk patients once released from observation showed that the members of the group who received these postcards had a higher prevalence of positive outcomes regarding suicide attempts than those who did not.
- The relatively new “Suicide Implicit Association Task” (IAT) questionnaire, which takes five to 10 minutes to complete, can be predictive of who is at risk and can be effectively employed in hospital emergency departments.
- Motor vehicle poisoning deaths accounted for approximately 1,000 suicides in 2012. These deaths can be prevented via a simple shut-off system added to motor vehicles that could prevent the engine from running if a dangerous carbon monoxide threshold is breached.
- Finding ways to restrict firearm access for individuals at risk, as firearms are currently the most common means of accomplishing suicide in the U.S., could also be an effective reducer of suicide risk.
Conclusion
In recent years, suicide risk has grown and developed in several unanticipated ways. Insurers mitigate some of their back-end risk via contestability periods, but going forward, insurers might want to consider how products or underwriting can be structured to strengthen their ability to help insureds through times of pain or peril.