Motor vehicle records (“MVRs”) provide history of individuals’ prior driving citations and are commonly used by underwriters to aid in the risk assessment of insurance applicants.
This study, completed jointly by LexisNexis® and RGA Reinsurance Company, analyzes the mortality of applicants linked to MVRs. LexisNexis, a major provider of MVRs to the insurance industry, provided RGA the driving violation histories where permitted for research purposes, for a random sample of applicants. Deaths from this sample were identified through a sweep against the Social Security Death Master file (SSDMF). The authors used this data to complete an actuarial mortality study and analyzed the results using a severity scoring algorithm developed independently by RGA underwriters. The results from this study may be used to quantify the additional mortality risk of applicants with adverse driving records and to assess the protective value of MVRs in life underwriting.
Background
Fatal motor vehicle accidents represent a significant component of all-cause mortality in the U.S., especially at younger ages. According to the U.S. National Highway Traffic Safety Administration, over 33,000 individuals died in crashes in 2009(1). Adverse driving records may also indicate other lifestyle risk factors such as alcohol or substance abuse. Among motor vehicle fatalities in 2009, 32% involved drivers with blood alcohol content (BAC) in excess of 0.08%(1). Impaired drivers tend to repeat their dangerous behaviors. On average, a drunk driver has driven drunk 80 times before his or her first arrest(2). Impaired drivers involved in fatal crashes are eight times more likely to have previously received a DWI arrest than non-impaired drivers and 25% of impaired drivers involved in fatal crashes have previously had a suspended or revoked license(1).
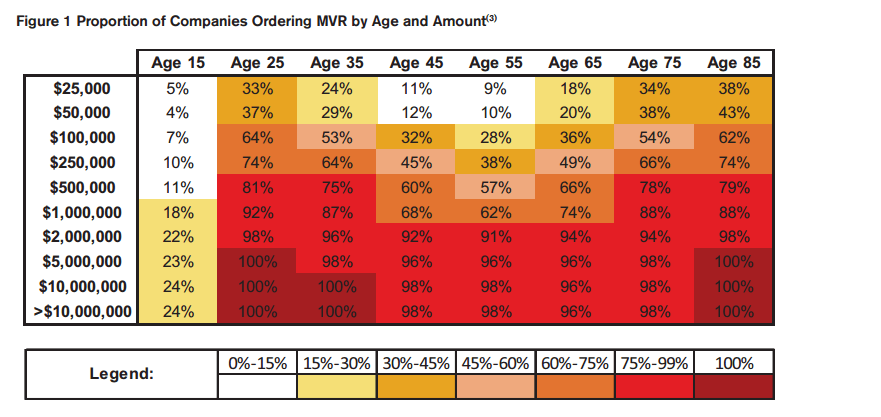
In recognition of the extra risks associated with impaired or risky driving along with the associated lifestyle or behavioral risk factors, MVRs are a common component of life insurance underwriting requirements. Figure 1 shows the percentage of companies known to be ordering MVRs at various ages and amounts, according to internal RGA research of over 50 individual companies’ underwriting requirements. Only companies that include MVRs on their age and amount grids are used in this analysis. This display illustrates that MVRs are commonly ordered at larger face amounts and at both younger and older ages. Historical analysis of these grids shows that MVRs have become increasingly popular over the past 15 years, but have started to decline slightly in recent years.
Anecdotal discussions with life company underwriters and product mangers indicate increasing uncertainty about the cost of MVRs relative to the potential benefits. This study will attempt to quantify the cost/benefit trade-offs to help address this.
Summary of Results
This study provides an all-cause mortality analysis of applicants based on their motor vehicle driving records. The study is large in scale, including over 7 million applicants and approximately 73,000 deaths during the study period. The main conclusions include the following:
- Significant all-cause mortality differentials are observed between applicants with clean or modest motor vehicle records and those with major motor vehicle violations. In total, the relative mortality of applicants with “Major” violations is 170.7% of the aggregate level.
- Significant all-cause mortality differentials are also observed based on the number of an applicant’s previous motor vehicle violations, regardless of the severity of the violations. In total, applicants with six or more violations have mortality of 179% of the aggregate level.
- Similar trends by violation severity and number of violations are observed across all ages and both genders, although the prevalence of adverse MVRs varies significantly.
- The extra mortality risk presented by individuals with adverse motor vehicle histories is probably better represented by a mortality multiple (i.e., table rating) rather than a flat extra mortality load.
- MVRs likely provide positive protective value across a wide spectrum of ages at relatively low face amounts.
Data and Method of Analysis
The underlying data for this study was provided by LexisNexis, a leading provider of motor vehicle records for the insurance industry. LexisNexis aggregates motor vehicle records from the states and offers a proprietary Standard Violation Code service to facilitate reporting consistency across states. For this study, LexisNexis provided a random sample, where permitted for research purposes, of approximately 7.4 million MVR requests made between 2006 and 2010. The sample methodology was defined to ensure that enough information was available on each record to facilitate an unbiased sweep against the SSDMF. The vast majority of these requests were made on behalf of automobile insurance applicants.
LexisNexis utilized its proprietary identity matching algorithms to match the names of applicants to the SSDMF. After the initial sweep against the SSDMF and a secondary data scrub to remove false matches, approximately 73,000 deaths were identified between study years 2007 and 2010.
LexisNexis provided RGA a database including the following elements for each MVR request in the sample (no personally identifiable information was provided to RGA for this research project):
- Date of MVR request
- State where driver’s license was issued
- Basic demographic data of the applicant (gender, birth month/year)
- Motor vehicle infractions and dates of infractions including the LexisNexis Standard Violation Codes
- Month/year of death for identified deaths
The authors used this database to complete an actuarial mortality study for calendar years 2007-2010. Expected mortality for each applicant was calculated using the most recently available U.S. Population Life Table(4). Actual-to-expected mortality ratios were calculated by dividing the actual number of deaths by the expected number deaths for each population segment being analyzed. Due to possible under-reporting in the SSDMF and uncertainty concerning the sensitivity and specificity of the identity matching and death-matching algorithms, the final results have been standardized as relative mortality ratios such that the grand total mortality ratio is exactly 100%. These relative mortality ratios are intended to provide an unbiased estimate of the mortality differentials between various segments of the study population. The confidence intervals around the mortality ratios displayed on the graphs were calculated using Byar’s approximation to the Poisson distribution between the 5th and 95th percentiles(5).
The mortality study results were stratified based on the perceived severity of an applicant’s past driving violations, which were pre-defined as either “Major” or “Minor” by RGA underwriters Mark Dion and Mary Hanson. Although there are hundreds of individual violation codes included in this assessment, “Major” violations include the following types of infractions:
- Alcohol or substance related infractions
- Speeding in excess of 30 mph above the speed limit
- Suspended, withdrawn, revoked, surrendered or cancelled drivers license
- Failure to provide proof of financial responsibility
- Failure to appear in court
- Reckless or negligent driving
RGA’s definition of “Major” includes all codes that LexisNexis categorizes as “Severe” in the LexisNexis Standard Violation codes as well as other codes considered serious by RGA’s life underwriters.
Results
The following sections provide details on the distributions and relative mortality differentials between various sub-segments of the study population.
Results by MVR Severity
As described in the “Data and Method of Analysis” section, each violation appearing in the data was reviewed by expert underwriters and subjectively classified as “Major” or “Minor”. Each individual applicant’s severity score is then defined according to the worst violation appearing in his or her motor vehicle record: Those with a “Clean Record”, those with only “Minor Violations”, and those with at least one “Major Violation.” Figure 2 shows the distribution of mortality study exposure and the relative mortality ratios broken out by these classifications. 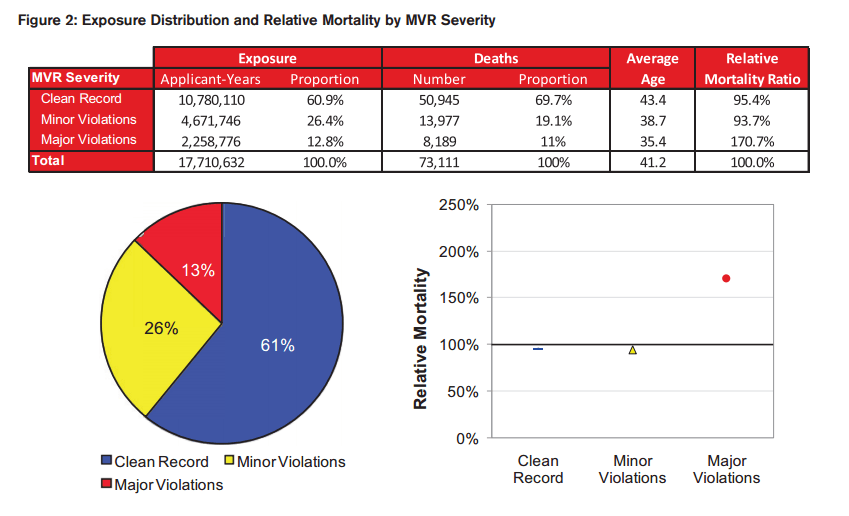
These results imply approximately 71% higher all-cause mortality for the 12.8% of the applicants with major violations on their MVRs.
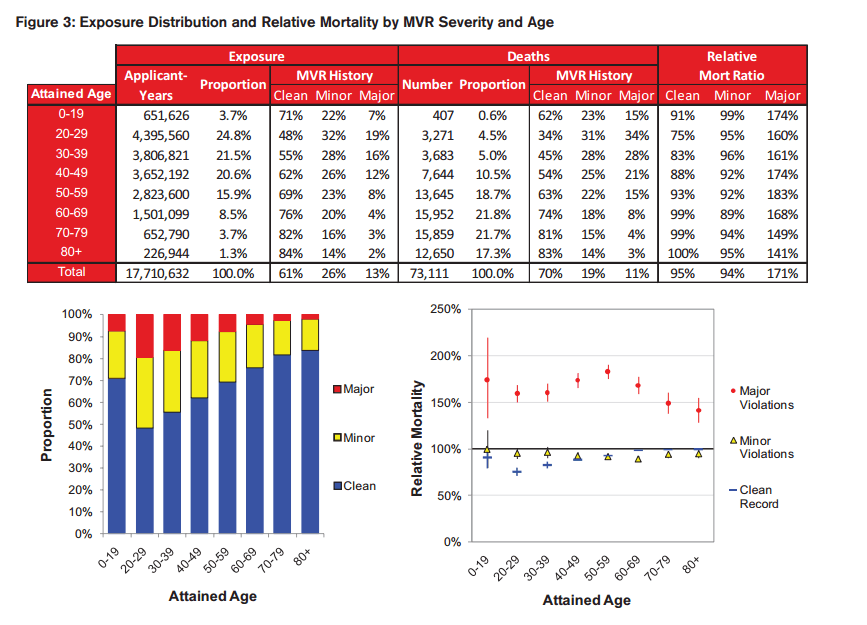
Further stratifying by age, we see in Figure 3 that the extra mortality for applicants with the highest severity violations is consistent across ages, although the magnitude varies. The prevalence of drivers with recent adverse driving records is highest at the younger ages, grading off at the older ages. Interestingly, the mortality for applicants with minor infractions is actually better than those with a clean record at older ages, although it is not statistically significant at all ages. It is possible that minor violations are serving as a proxy for active lifestyles or favorable cognitive function at the oldest ages.
The most significant finding from the by-age results is that, although the relative mortality ratios vary by age, they do not vary nearly as much as a flat extra mortality load would imply. To illustrate this, we created a simple 10-year actuarial present-value model assuming mortality from the 2008 Valuation Basic Select & Ultimate table (VBT) with a 6% lapse rate and 6% discount rate. Under these assumptions, 170% of 2008 VBT mortality in all years is approximately equivalent to a $0.70 3-year temporary flat extra for a 25 year old male non-smoker, but it is approximately equivalent to a $21.00 flat extra at age 70.
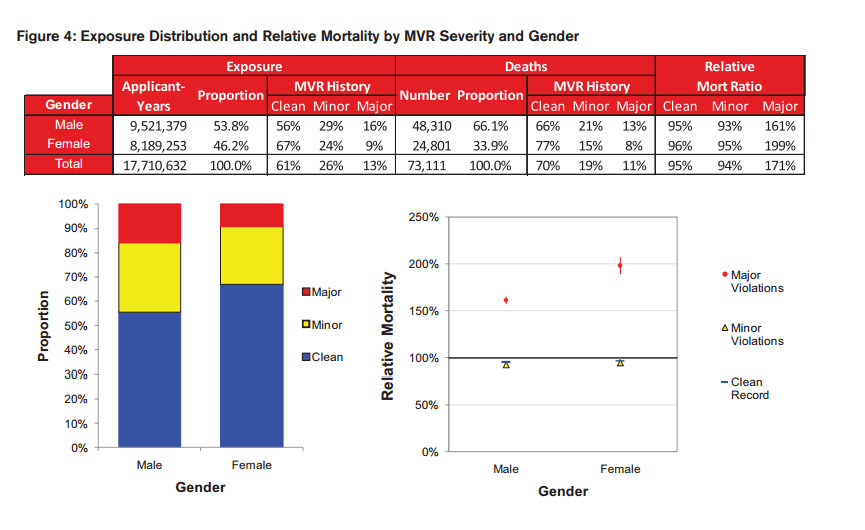
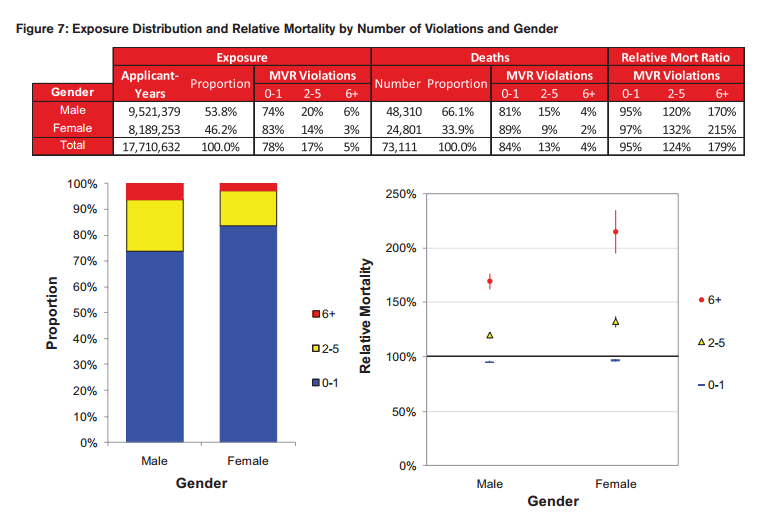
Females have a lower prevalence of adverse driving records, but those with major violations experience higher mortality differentials compared to males, as can be seen in Figure 4.
Results by Total Number of Violations
The next segmentation is by the total number of violations appearing on an applicant’s MVR, regardless of the assigned severity. Figure 5 displays the monotonically increasing mortality based on the number of total violations on record for an applicant.
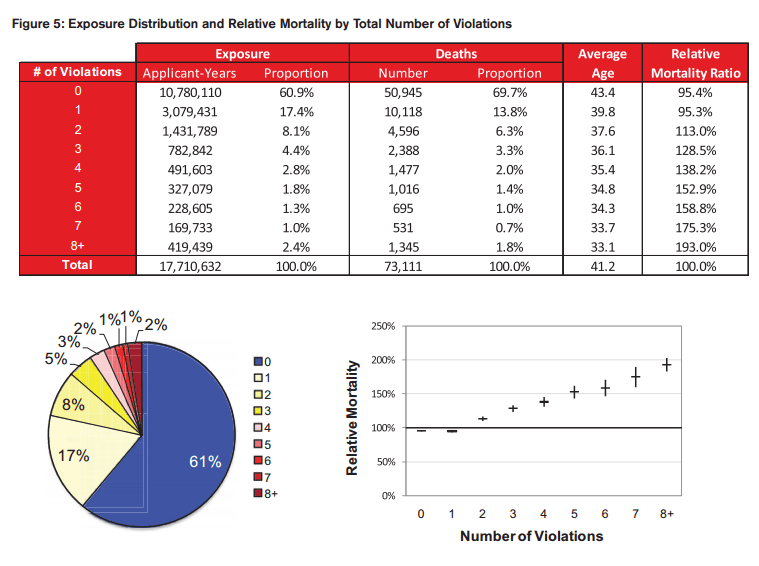
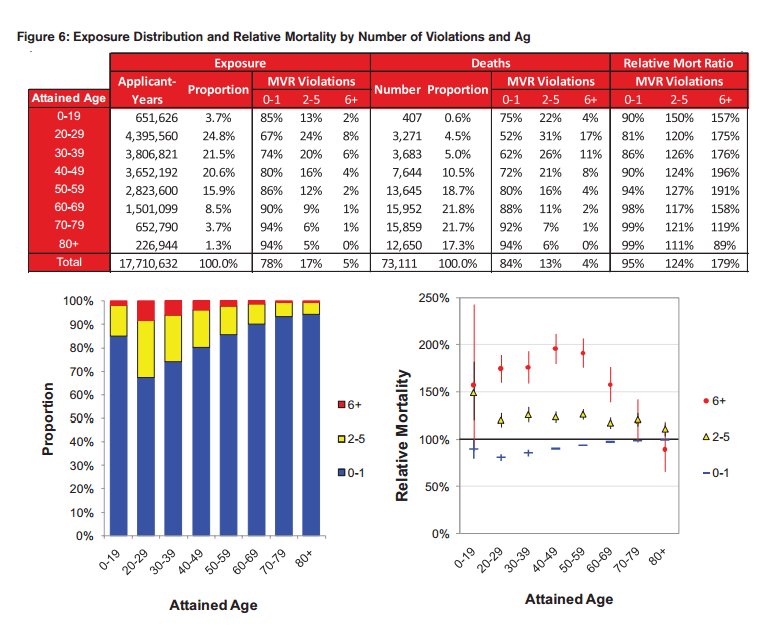
Figures 6 and 7 combine the results by the total number of violations and age and gender. These results suggest that the number of violations is an important predictor of excess mortality, especially at the younger ages.
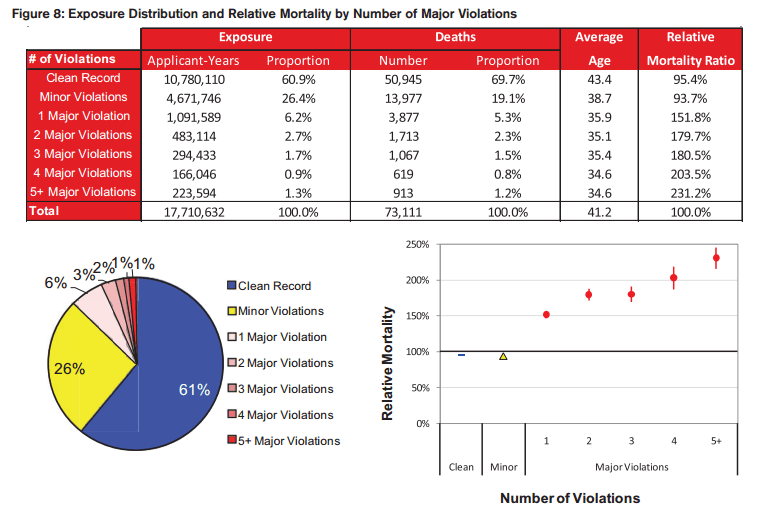
Results by Number of Major Violations
Even further stratification can be explored by studying the number of “Major” violations an individual has on his or her MVR. Drivers with a high number of major violations would be expected to represent the worst risks, and the results shown in Figure 8 support this hypothesis.
Protective Value
The potential mortality savings from a specific piece of underwriting evidence can be calculated as the present value of excess mortality for those applicants where the evidence accurately and uniquely identifies the impairment. Positive protective value is provided when the mortality savings exceeds the cost of acquiring the evidence.
Although a precise protective value calculation is beyond the scope of this paper, we will suggest a framework for using the results from this study to estimate protective value. To estimate the mortality savings, a 10-year actuarial present value model was created using a 5.5% discount rate, a 6% annual lapse rate, and age and gender specific mortality differentials relative to 100% of the 2008 VBT Select & Ultimate table. The mortality savings are broken out in the following way:
A) The actuarial present value of death benefits expected to be paid for this policy. This will be calculated using the model described above.
B) The relative mortality differential between applicants with “Major violations” and those without. This comes directly from the mortality experience provided in this paper.
C) The prevalence of applicants with “Major violations”. This also comes directly from the exposure distributions in this paper. As discussed previously, the applicant population was largely composed of automobile insurance applicants from a wide cross-section of states. To the extent that life insurance applicant populations may have different (presumably lower) prevalence rates of adverse MVRs, an additional adjustment may be warranted.
D) The exclusivity of the MVR evidence in making an adverse underwriting decision. This represents the percentage of the time that the MVR evidence was the only source of information for an adverse action on a policy.
The total mortality savings are then calculated as A*B*C*D and then compared to the cost of the MVR. The protective value analysis is summarized in Figure 9 in three different ways:
- Break-Even Face Amount: This is the minimum face amount above which the mortality savings would exceed the cost of the test. This model assumes an MVR cost of $9 and a 25% exclusivity factor for the MVR evidence relative to other available underwriting information. Under these assumptions, MVRs would provide positive protective value for policies above $40,000 for males age 45.
- Savings/Cost Ratio: This is the ratio of the mortality savings to the cost of the MVR for a $250,000 policy assuming 25% MVR exclusivity. Under these assumptions, MVRs provide a Savings/Cost ratio of 6.3 to 1 for males age 45.
- Required Exclusivity: This is the minimum MVR exclusivity required for positive protective value for a $250,000 policy. The MVR evidence would need to be the exclusive reason for making an adverse decision 4% of the time for males age 45.
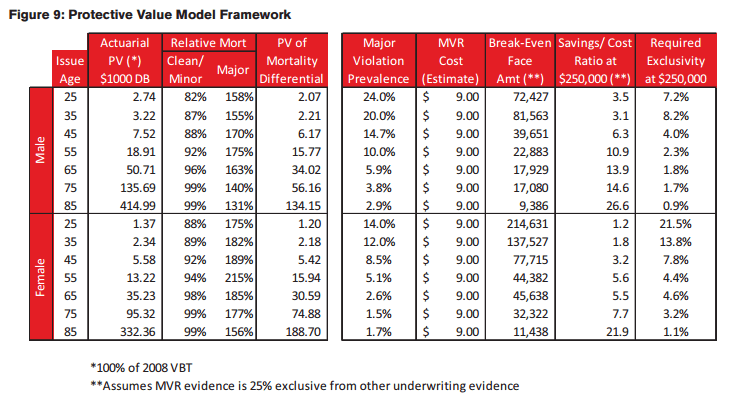
This calculation is purely illustrative and further research would need to be performed to quantify an appropriate exclusivity factor and make any other necessary adjustments to convert this applicant population to a life insurance population. However, the results seem to point favorably to the protective value of MVRs, especially for males and at older ages. At younger ages and smaller face amounts, the true exclusivity factor for MVRs will be higher than at older ages and larger face amount due to the differences in the amount of other underwriting evidence gathered.The total mortality savings are then calculated as A*B*C*D and then compared to the cost of the MVR. The protective value analysis is summarized in Figure 9 in three different ways:
Areas for Future Analysis
This study has covered some of the basic areas of interest by quantifying mortality differentials by MVR severity and the number of violations. A number of additional areas can also be researched in the future, including the following:
- Time specific analysis would allow for validation of MVR underwriting by the number of years since last violation, DUI, moving violation, etc. This would also provide an indication of the slope of the selection associated with MVRs.
- Specific violations or classes of violations could be analyzed where statistically credible, including the following:
- DUI/DWI
- Moving violations vs. non-moving violations
- Distracted driving
- Speeding
- Accidents
- Administrative withdrawal or lack of financial responsibility (SR-22)
- Motorcycle licenses or violations
Limitations
A number of potential limitations should be considered when interpreting the findings from this report:
- The reported violation may have been pleaded down from a higher infraction or the record may have been expunged. In these cases, the final violation is what would be reported. This is consistent, however, with the information that an underwriter would typically see.
- The results have been summarized for analysis based on the maximum severity violation or the number of violations. This is a simplification of the underwriting process designed only to illustrate the link between an applicant’s MVR and mortality risk. For underwriting, the MVR must be viewed in totality to consider the total risk profile of an applicant.
- To prevent bias in the results reported in this study, our underwriters developed the classification of “Major” violations without access to the mortality study results. Further analysis of these results at a more granular level will likely lead to a more robust risk classification framework for violations.
- SSDMF underreporting or incorrect identity matching could lead to inaccurate gross mortality rates, although the use of relative mortality ratios should largely mitigate this risk to provide an unbiased estimate of the mortality differentials by the variables analyzed herein.
- As mentioned earlier, the population for this study was primarily composed of automobile insurance applicants. Differences in socio-economic status, demographic composition or other relevant variables in a life insurance applicant pool may result in a different prevalence distribution and mortality risk for major violations.
- Although expected mortality rates have been controlled for age and gender, other behavioral risk factors including tobacco use, alcohol abuse, or other lifestyle factors may be more prevalent among the cohort with Major Violations. This should be reflected in the exclusivity assumption when considering protective value.