It’s 8 a.m. and you are driving to work. Within minutes of merging into traffic, you notice your fellow drivers engaged in a variety of activities: talking on the phone; adjusting their navigation systems; or texting, emailing, and snapchatting. It seems people behind the wheel are focused on just about anything but the most important task at hand: driving their cars.
The statistics are clear – distracted driving is deadly. Each day in the U.S., more than eight people lose their lives and 1,161 are injured in crashes involving a distracted driver.1 In studies that used cameras to observe drivers, adults who looked away from the road for two seconds or longer were twice as likely to crash or nearly crash.2 Then consider this: the CDC reports that the average text takes the driver’s eyes off the road for five seconds, which at 55 miles per hour is enough time to drive the length of a football field.3
While there are many sources of driver distraction, technological devices are proving more cognitively engaging – and perhaps more dangerous as a result. Epidemiological studies have found that cell phone use while driving is associated with a fourfold increase in crash risk.4
Recently, researchers measured brainwaves, eye movement, and other reactions to assess how drivers listened and responded to in-vehicle, voice-activated email features – and found that these technologies substantially increased mental workload and distraction. It is unsurprising, then, that the U.S. National Safety Council (NSC) estimates that 26% of all traffic crashes are associated with drivers using cell phones and text messaging.5
Yet we cannot seem to resist the “ping” of these palm-sized supercomputers.
In 2014-2015, the National Highway Traffic Safety Administration recorded the largest spike in crash deaths since before the U.S. government mandated seat belts in cars, and the problem is not limited to talking or texting.6 Cognitive psychologists and human-factors engineers also point to emerging social media and in-car technologies, from Snapchat and Instagram to Google Maps and Pokemon Go. In a 2016 NSC survey of 2,400 drivers of all ages, 74% said they would use Facebook while driving, followed by Twitter (37%), YouTube (35%), and Instagram (33%).7
To better understand the mortality risk posed by distracted driving and its potential impact on the insurance industry, RGA conducted a robust study in 2014. The findings remain relevant today:
- We analyzed data from the National Highway Traffic Safety Administration’s (NHTSA’s) Fatality Analysis Reporting System (FARS) to better understand the role distracted driving plays in fatal automobile accidents in the U.S.
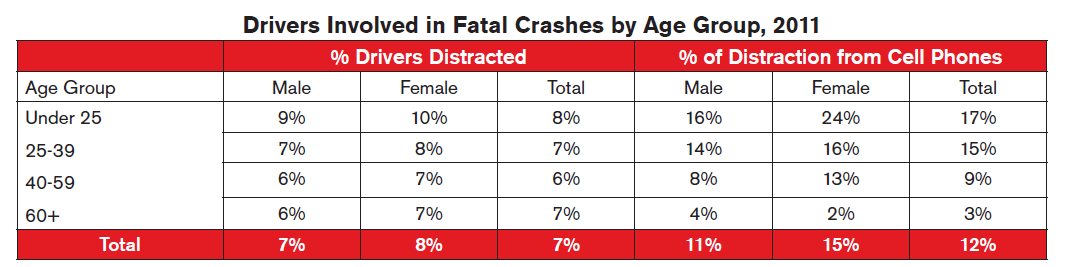
- Overall, the percentage of fatal distraction-affected crashes did not vary greatly by age or gender. However, younger drivers (especially females) involved in fatal accidents were more likely to have been distracted by cell phones than other causes.
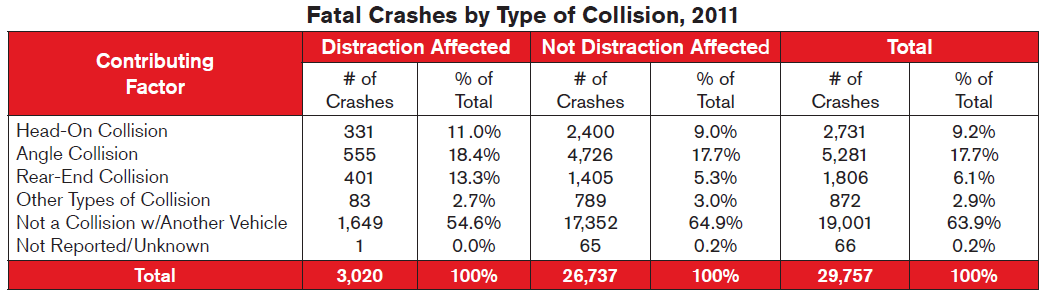
- A higher proportion of fatal rear-end collisions was the result of driver distraction than collisions involving non-distracted drivers.
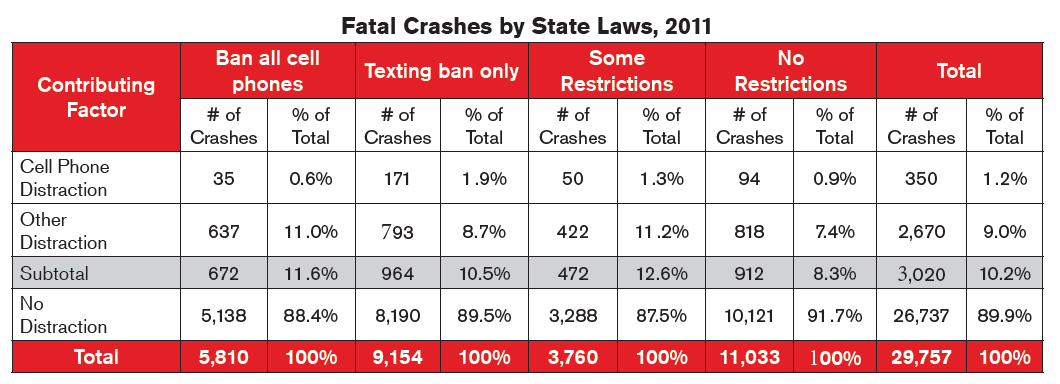
- There is a difference in collision experience by state, but it is unclear if state laws limiting the use of cell phones while driving have had the desired effect of improved safety.
- We compared the mortality experience of those individuals with a distraction-related citation appearing on their Motor Vehicle Record (MVR) to those with other types of citations as well as individuals with clean driving records.
- Drivers with a distraction-related citation had higher all-cause mortality than those with other citations and much greater relative mortality than those with a clean record; therefore, it is likely that people who use cell phones while driving engage in other risky activities, increasing their overall mortality risk.
- Finally, we surveyed nearly 100 underwriting professionals from the insurance industry to comment on their companies’ current approach to underwriting distracted-driving infractions.
- Distracted driving violations are currently a consideration in many companies’ underwriting process, though generally the type of distraction is not considered. However, in spite of this, most companies surveyed consider a texting violation to be more serious than other types of distracted-driving infractions.
Overview
Driver Distraction
Each year about 35,000 people die in the United States as a result of motor vehicle accidents. In 2011, accidental deaths were the fifth leading cause of death in the United States, and motor vehicle accidents accounted for 28% of all accidental deaths. [3] However, the age-adjusted motor vehicle death rate is now less than half the rate experienced in 1980,[4] and the improvement is largely due to improved automotive engineering and regulations. Vehicle safety equipment such as seatbelts, child safety seats, air bags, antilock braking, mandatory helmet laws as well as drunken driving laws have all contributed to the reduction in traffic fatalities. Even with this decline in the death rate, motor vehicle accidents continue to be the leading cause of death in children and young adults under age 24, and addressing this issue remains an important aspect of improving public safety.
It is estimated that nine out of 10 motor vehicle accidents are due to driver error, and nearly 80% of all crashes are caused by driver inattention. According to NHTSA, distracted driving is “a specific type of inattention that occurs when a driver’s attention is diverted from the driving task to focus on a non-driving activity instead.” NHTSA investigated the prevalence of driving while distracted as a part of the National Motor Vehicle Crash Causation Survey (NMVCCS). The data suggests that younger drivers are more likely to be distracted by factors inside the vehicle, whereas older drivers are more distracted by non-driving cognitive activities.[5]
Non-driving cognitive distractions include concentration on issues such as personal problems or financial difficulties. Additionally, numerous internal distractions compete for a driver’s attention. [5] Examples of these types of distractions include:
- Eating and drinking while driving
- Retrieving a fallen object while the car is in motion
- Adjusting the radio and other vehicle controls
- Cell phone distraction such as making calls, talking on the phone, and sending or reading text messages or email
- Passengers causing a driver to look away from the road or become distracted in conversation
There are three broad sources of driver distraction: visual, manual and cognitive. Activities that require multiple sources of a driver’s attention are likely to be more dangerous to traffic safety. NHTSA conducted an experiment where the study participants were tested in a driving simulator performing secondary tasks such as adjusting the radio, utilizing a navigation system, dialing a 10-digit number, dialing a phone using a contact selection, and text messaging. The experiment demonstrated that text messaging impacted driving ability the most, followed by 10-digit phone dialing, while adjusting the radio had the least impact on driving. It is no surprise that writing an email or sending a text has the most impact since these tasks combine all of the visual, manual and cognitive sources of distraction. [6]
Not all distractions are equally likely to cause an accident. While in-vehicle conversations commonly occur prior to an automobile accident, conversation is not necessarily a contributing factor to an accident. In fact, research conducted at the University of Utah indicates a small safety advantage to driving with adult passengers, with no additional risk of an accident from in-vehicle conversations. This is because adult passengers are able to assist drivers by pointing out hazards and navigation and are able to adjust conversation to the traffic conditions.[7]
Conversely, cell phone use may be more distracting because it is more cognitively engaging, interactive and performed over longer periods of time.[1] This category of electronic distraction has been the source of much discussion among those concerned with traffic safety.
Cell Phone Prevalence and Usage
As of May 2013, 91% of American adults owned a cell phone and 56% owned a smartphone. Cell phone and smartphone usage is even more prevalent among those with higher income and education levels, as well as among younger individuals.
Cell phone technology and usage have changed dramatically in the last decade, especially with the introduction of smartphone technology, which offers far more advanced features than a simple cell phone. In the U.S. the number of cell phone subscribers more than doubled from 2002 to 2012. The increase in the number of smartphone subscribers has outpaced the growth in overall cell phone subscriptions, with three times the number of smartphones in use in 2012 than in 2009.
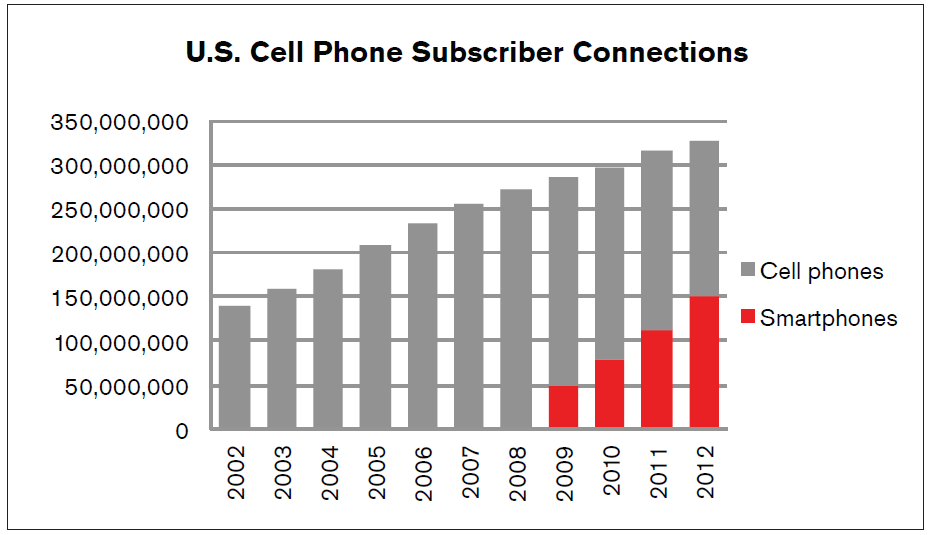 Even more dramatic, the number of text messages sent increased 900% from 2007 to 2012.[9] Of those owning cell phones, more than 80% send or receive text messages and more than half send or receive email. [10] Additionally, Experian currently estimates that smartphone owners aged 18 to 24 send an average of 67 texts per day and receive about 60 per day. This amount is approximately double the number sent and received by 25- to 34-year-olds and about 10 times the number of texts sent by Americans aged 55 and older. [11]
As technology has become more advanced and more people own smartphones, the number of people sending texts while driving has increased. From 2005 to 2011, an observational study by NHTSA estimated that the number of drivers on the road who are texting while driving has increased nearly every year, from 0.2% in 2005 to 1.3% in 2011. [12]
In 2011, NHTSA estimated that 9% of all drivers on the road were using some type of phone while driving; this includes talking on hand-held or hands-free phones and texting. Younger drivers are more likely than older drivers to use cell phones while driving. It was also estimated that 7% of drivers aged 16 to 24 were using hand-held cell phones while driving, and 5% of drivers aged 25 to 69 and 2% of drivers 70 years of age and older were talking on a hand-held phone while driving. [12]
According to a nationally representative sample conducted in 2010 by the Pew Research Center, 75% of adults who own a cell phone have talked on it while driving, and nearly half of all texting adults have sent a text while driving. [13] Further, many drivers report regular cell phone use while driving. In 2011, the AAA Foundation for Traffic Safety conducted a representative telephone survey to assess the prevalence of cell phone use while driving. The question was, “In the past 30 days, how often have you talked on a cell phone while driving?” Thirty-one percent responded “Regularly” or “Fairly Often”, 37% responded “Rarely” or “Just Once”, while 31% responded “Never”. [14] Clearly many Americans are using cell phones while driving.
Impact of Cell Phone Use on Driving Ability
Technological distractions may be more cognitively engaging and thus more dangerous than other forms of distraction. The University of Utah has conducted several studies using a driving simulator to assess a driver’s ability to operate a vehicle while using a cell phone. The studies found the likelihood of an accident involving a person driving while using a cell phone was similar to a car driven by a legally intoxicated driver. Compared to a baseline scenario, those using a cell phone drove more slowly and at an increased following distance, had a delayed response to hazards, and took longer to recover their speed to the original pace. The delayed response time resulted in an increased likelihood of rear-end collisions for drivers using cell phones.[1]
While there are many sources of driver distraction, they vary in the degree to which they divert a driver’s attention. A study of commercial vehicle operators estimated that a “safety critical event” is 23 times more likely to occur while texting, and nearly 6 times more likely while dialing a cell phone. A “safety critical event” includes crashes, near-crashes, crash-relevant conflicts, and unintentional lane deviations.[2] Another study found that talking on a cell phone increased the risk of an accident fourfold. [15] Evidence clearly suggests that distraction caused by cell phone use while driving poses a significant risk to traffic safety.
In the studies conducted at the University of Utah, an individual’s driving ability did not improve when using hands-free technology. Drivers conversing on hands-free cell phones reported an inability to see important traffic factors. This inability to direct attention away from the cell phone conversation to the driving environment is referred to as “inattention blindness”. [1] [15] Many current attempts to improve traffic safety rely on hands-free technology, which is not effective in mitigating driving impairment.
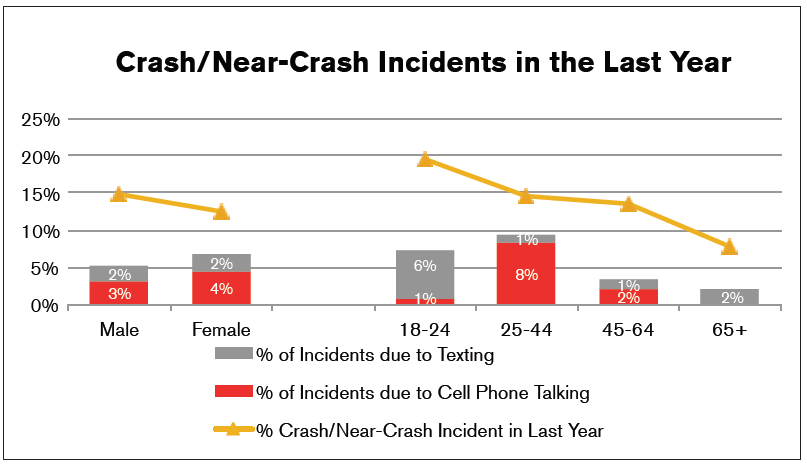
In a nationally representative telephone survey conducted by NHTSA, respondents were asked to describe automobile crashes and near-crashes from the past year. Younger drivers aged 18 to 24 had the highest percentage of crash/near-crash incidents, and the percentage of reported incidents declined with age. More than 13% of incidents involving drivers aged 18 to 20 were cell phone-related; however, among drivers aged 18 to 24, a little more than 7% of these incidents were attributed to cell phone usage. The vast majority of the cell phone-related incidents experienced by young drivers were attributed to text messaging, while drivers aged 25 to 44 reported a significant portion of incidents related to talking on a cell phone. Overall, males reported more crash or near-crash incidents than females; however, females attributed a higher percentage of incidents to cell phone use than males.[16]
 NHTSA also measures traffic accidents attributed to driver distraction. In 2011, 10% of all fatal automobile accidents and 17% of all injury crashes were due to distracted drivers. Because each accident potentially involves multiple drivers, 7% of the drivers involved in fatal accidents were identified as distracted. [17]
Efforts to Reduce Distracted Driving from Cell Phones
In April 2013, the U.S. Department of Transportation (DOT) issued voluntary guidelines to reduce distracted driving accidents.[18] Recommendations included the following:
Vehicle manufacturers should place limitations on built-in devices related to communication, entertainment and navigation.
Drivers should limit activities that take their eyes off the road for more than 2 seconds at a time and no more than 12 seconds total for the task.
Drivers should avoid texting and using video equipment while driving.
People generally perceive little impact on their own driving ability from talking on a cell phone. Because the DOT guidelines are voluntary, many states have enacted laws restricting cell phone use while driving in an effort to improve traffic safety. The most common restriction of cell phone usage while driving is a ban on texting while driving. As of July 2013, 41 states had laws that ban text messaging for all drivers; six states ban text messaging for novice drivers, with three of these states also prohibiting school bus drivers from text messaging. Laws banning talking on cell phones while driving are less common, with only 11 states banning hand-held cell phone use for all drivers. However, many states restrict hand-held cell phone use by drivers in certain areas such as school zones or construction zones, in addition to restricting hand-held cell phone use by novice drivers and school bus drivers. Only eight states lack any laws restricting talking on a cell phone while driving. [19]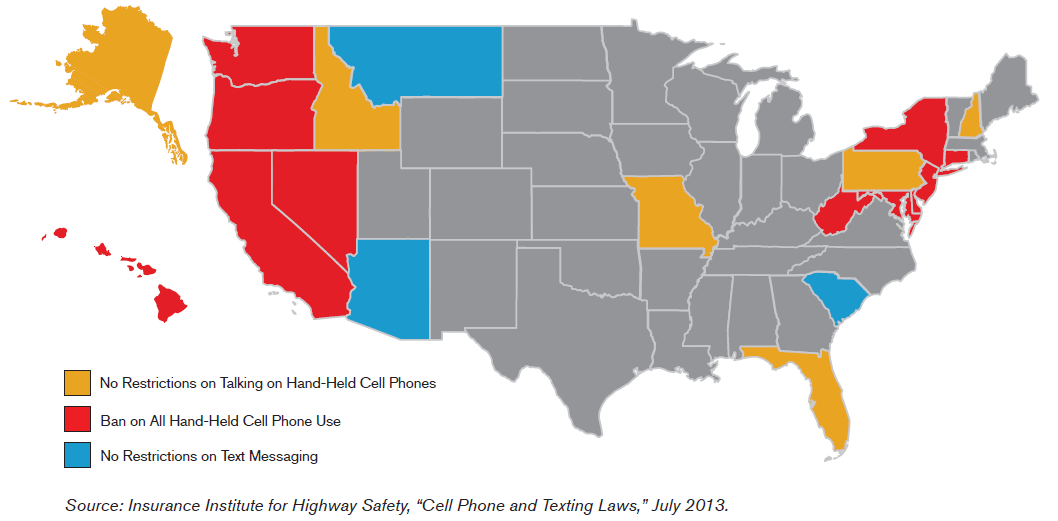
The Insurance Institute for Highway Safety (IIHS) has studied the effectiveness of laws banning cell phone use on improving collision claim experience. Following hand held cell phone bans in California, Connecticut, Washington, D.C., and New York, the IIHS found that fewer people were talking on a hand-held phone while driving. However, this ban did not coincide with reduced collision claim experience relative to the expected experience without a ban. [20] Perhaps drivers switched to hands-free technology, which did not result in improved experience.
The IIHS also studied the effectiveness of text messaging bans in California, Louisiana, Minnesota and Washington. Surprisingly, there was some evidence that collision claim experience actually worsened following the texting ban. The collision experience for young drivers showed the most pronounced increase in frequency following the ban. One possible explanation for the unexpected increase following implementation of the law is that texting did not actually decline following the ban. Rather, drivers hid their texting activity, resulting in increased time with vision away from the road. [21]
The intent of laws restricting the use of electronic equipment while driving is to reduce driver distraction and improve highway safety. However, laws will not improve crash experience if drivers do not modify their behavior. Consequently, many public service campaigns have been created in an effort to increase awareness about the dangers of distracted driving. The website www.distraction.gov features a pledge to “drive phone free”. In 2009, “The Oprah Winfrey Show” introduced the “No Phone Zone Pledge”. Since its inception, more than 400,000 pledges have been submitted. [22] In 2013, the documentary “From One Second to the Next” was released as part of AT&T’s “It Can Wait” campaign to encourage people to not text and drive. The movie will be released to 40,000 schools and is available on YouTube. As of August 2013, more than 2 million people have pledged to not text and drive on ItCanWait.com. [23]
Employers are potentially liable for automobile accidents caused by distracted driving by employees. For this reason, the National Safety Council (NSC) has developed a “Cell Phone Policy Kit” for employers. The cell phone ban proposed by the NSC would include both hands-free and hand-held devices, and apply to all employees when they use company vehicles and devices, or when they send company communications from personal devices. [14] In a 2010 survey of Fortune 500 companies, 18% of respondents indicated they had implemented complete cell phone bans for all employees. Of the companies with bans, 20% indicated a reduction in the number of crashes and the amount of property damage losses, while the remaining companies either saw no change or were unable to quantify the impact of the policy. [24] As employer liabilities from employee cell phone use grow, it is likely more organizations will ban employees from using company or personal cell phones while driving.
Perhaps paradoxically, there are a number of smartphone applications designed to reduce driver distraction. Several apps disable phone functioning while the vehicle is being driven. Sprint’s Focus on Driving app sends calls directly to voicemail and responds to texts with a message that the person is currently driving and will return the message later. [25] The Cell Control app identifies when the car is moving and disables functioning automatically. [26] Textecution disables the text function while the vehicle is in motion and sends a message to a parent if a teenage child removes the app from the phone. [27] Another app designed to “stop distracted driving” reads and responds to emails and texts out loud, without requiring the driver to type. [28]The effectiveness of these tools in minimizing distraction depends on the driver’s use of them as well as the function of the applications themselves.
Efforts to reduce driver distraction – from laws banning cell phone use while driving to apps that disable the text function while a person is driving – have produced mixed results. It is clear that hands-free cell phone technology, while providing convenience for the user, does not necessarily translate to increased safety on the road. Several research studies have found that hands-free technology is no less distracting than hand-held cell phone use. [29] This research calls into question the perceived effectiveness of both laws banning hand-held cell phone use, as well as functionality that involves oral commands in lieu of typing.
Fatal and Non-Fatal Motor Vehicle Crashes in the United States
Fatal and Non-Fatal Motor Vehicle Crashes in the United States
NHTSA maintains the Fatality Analysis Reporting System (FARS), which provides yearly data on all motor vehicle traffic crashes in the U.S. that involve a fatality. The 2011 FARS database contains extensive information about every fatal motor vehicle accident, including driver characteristics, occupant information, vehicle descriptions, environmental factors as well as details regarding possible driver distraction during a fatal accident. For the analysis that follows, we used the FARS database to better understand the role that distracted driving plays in motor vehicle fatalities.
The percentage of distracted drivers involved in fatal accidents does not vary greatly by gender. However, female drivers were more likely than males to be distracted by cell phones than by other causes. Similarly, the percentage of distracted drivers involved in fatal crashes only varies slightly by age group, but younger drivers involved in fatal accidents were more likely to be distracted by cell phones than older drivers. Interestingly, this distinction seems to be magnified for female drivers.[30]
The experience in the FARS dataset also shows a higher proportion of rear-end collisions, which account for 13.3% of fatal distraction-affected crashes, compared to 5.3% of crashes that were not affected by distractions. Fatal head-on collisions also occur at a slightly higher rate for distracted drivers.
During 2011, states banning all cell phone use experienced a smaller percentage of fatal crashes due to cell phone distraction than the 2011 average. States with only a text messaging ban experienced a higher percentage of fatal crashes related to cell phone distraction, which could support the notion that texting does not decline following bans. However, states that have no restrictions on cell phone use of any kind have a lower proportion of fatal crashes attributed to distraction than states with full or partial restrictions, therefore, it is not clear that laws limiting the use of phones while driving have had the desired effect of reducing fatal distraction-affected crashes.
NHTSA also collects and reports accident data from a representative random sample in the General Estimates System (GES) database, which is part of the National Automotive Sampling System (NASS). The GES database includes minor, serious and fatal crashes for about 60,000 accidents per year from police accident reports across the country.
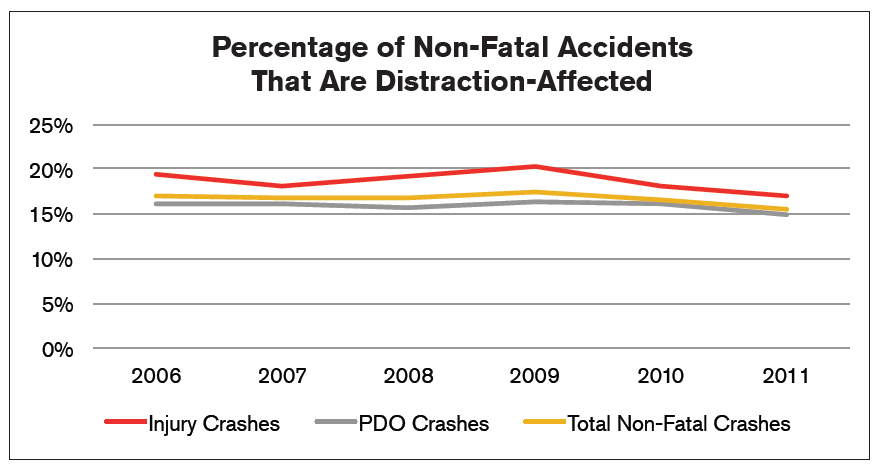
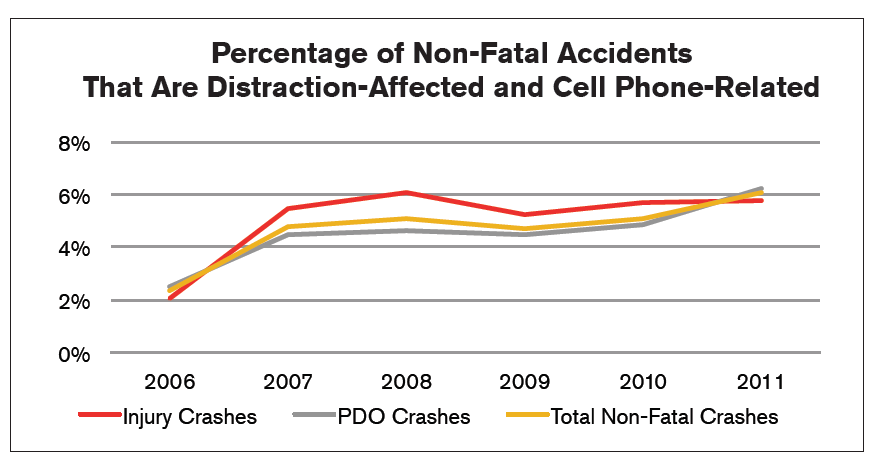
The current definition of distracted driving being used by NHTSA has only been used in fatal accident statistics in the FARS dataset since 2010, consequently it is not currently possible to analyze trends in fatal distraction-affected accidents. However, non-fatal accidents have employed the current definition of distraction for many years, so we were able to analyze trends in non-fatal accidents that were caused by driver distraction.
From 2006 to 2011, there was little change in the percentage of non-fatal accidents attributed to distracted driving. Over this period, approximately 16% to 17% of all non-fatal accidents were attributed to distracted driving. There was also very little change in the percentage of property damage only (PDO) accidents related to driver distraction. There was, however, a small decrease in the percentage of distraction-affected injury accidents, from 19% in 2006 to 17% in 2011. [17] [31]
During this same period, the percentage of non-fatal distraction-affected accidents related to cell phone use increased, most dramatically from 2006 to 2007.
While the FARS data provides detailed information about distraction-affected accidents, the National Safety Council (NSC) estimates that only about half of fatal, cell phone-related crashes are correctly attributed to cell phone-related distraction. This is due to coding errors as well as the difficulty in verifying suspected distraction and problems with reliability of eyewitness accounts of crashes. [32] Further, the NSC estimates that 23% of all traffic accidents involve cell phones. In 2011, it was estimated that approximately 1.2 million crashes were related to talking on a cell phone, while 100,000 crashes were due to texting. [33]
Experience from Motor Vehicle Records
To understand the potential impact of distracted driving on overall mortality, we expanded RGA’s previous research in the 2012 RGA/LexisNexis® Motor Vehicle Records (MVR) study. [34] The data used for the analysis in this paper is similar to that used in the 2012 study, but the focus is on driving violations related to distracted driving.
The initial challenge of this analysis was identifying which violations cover “distracted driving”. Unfortunately, some of the violation codes that are used lack specificity. While some states have created laws to address these new distractions (such as texting), several states have suggested that the laws already on the books are adequate to include distraction-related infractions. For example, in some states texting and cell phone use are included in the “careless operation” laws, but this violation can cover a variety of other offenses as well. It is also possible that a minor violation of distracted driving is coded as “Inattention Operation”, but the more serious offenses may be coded as “Careless Operation.” These imprecise definitions add some limitations to our results and may create some areas for further study and discussion.
For the purposes of this research, we classified the following Standard Violation Codes (SVCs) as being “distracted-affected” violations:
- Illegal Cell/Mobile Phone
- Inattention Operation
- Careless Operation
- Negligent Driving
- Unsafe Operation (not willful)
The approach used in this analysis was to:
- Compute all-cause mortality results (actual deaths compared to expected deaths from 2006 population tables) for: (a) those individuals with one or more distraction-affected violations appearing on their MVR, (b) those individuals with violations appearing on their MVR, but no distraction-affected violations, and (c) those individuals with an entirely clean record.
- Compute the relative all-cause mortality ratios of both the “distracted driving” violators and those with a clean record relative to the corresponding aggregate results of all drivers in the cohort we studied.
- Compute the relative all-cause mortality ratios of the “distracted driving” violators relative to those with a clean record in the cohort we are studying.
The overall mortality results demonstrate that drivers with a distraction-affected infraction on their record experience about 37% higher all-cause mortality results when compared to those with a clean driving record.
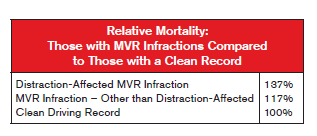
Because we are studying all-cause mortality, the additional mortality does not necessarily come from automobile accidents. It is possible that those who use cell phones while driving engage in other risky activities, thereby increasing their overall mortality risk.
Mortality experience varied widely by state; however, we could not identify any meaningful conclusions by state. While a state-specific analysis would be interesting, the results are complicated by ever-changing state laws as well as sparse data at the state level.
For a high-level view of mortality, we first compared those individuals with a clean record and those with one or more distraction-affected violations to the overall aggregate total of all drivers in a specific age group.
It is much less common for younger drivers to have a clean MVR when compared to older drivers. On the other hand, young drivers with a clean record have better relative mortality than the older drivers with a clean record. Only about 50% of those under age 30 have a clean MVR, and the relative mortality is about 78%. That said, about 82% of those over the age of 70 have a clean record, and the relative mortality is near 100%.
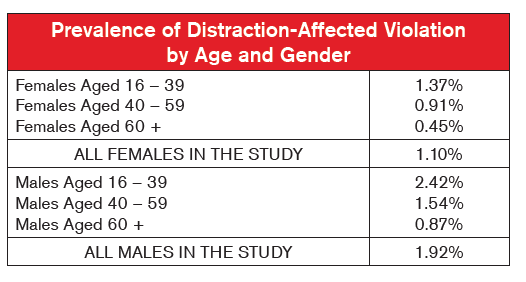
As shown in the chart below, the difference in relative mortality is greatest at younger ages. The prevalence of distraction-affected violations is about 2.5% for those under age 30 and decreases steadily to about 0.5% for those over age 70. It makes sense that the behaviors that lead to these types of violations decrease with age.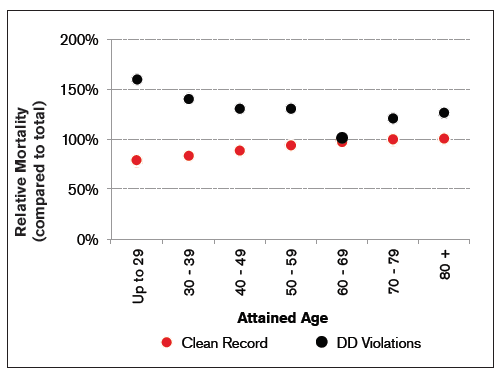
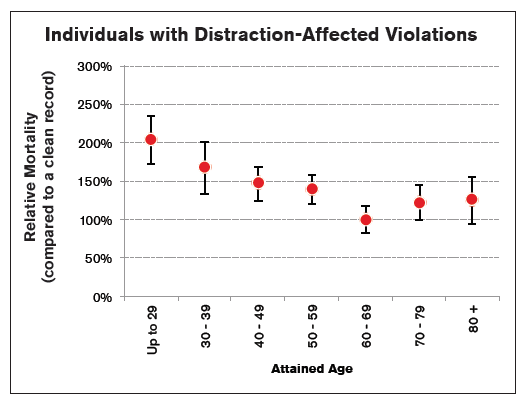
Because the mortality implications of a clean record vary by age, the same information is now presented a slightly different way. Those with distraction-affected violations are presented relative to those with a clean record. A 95% confidence interval is included, and results are consistent with the previous graphs.
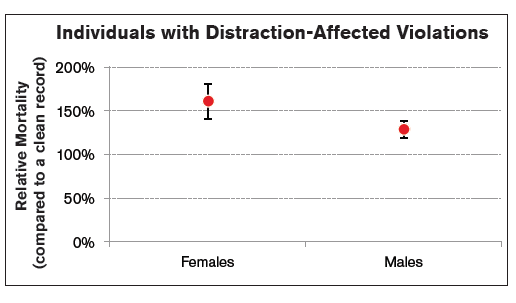
The chart below presents the results by gender. The results for females are slightly higher, but the prevalence is close to half that of the males. About 1.9% of males have a distraction-affected violation, whereas only 1.1% of females have such a violation.
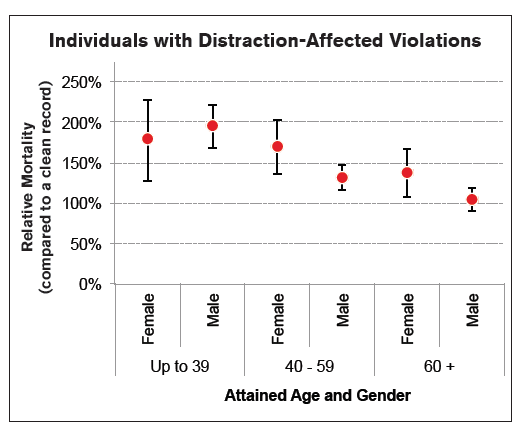
Finally, we present the results by age and gender along with the prevalence of distraction-affected violations. A 95% confidence interval is once again provided.
Survey of Underwriters
Industry’s Approach to Distracted Driving
RGA conducted a brief industry survey in August 2013 to assess the role of MVRs in the underwriting process. Part of this survey was designed to elicit information about the various approaches to distraction-related MVR infractions. We sent this survey to underwriting professionals at nearly 100 companies in the United States, with responses from 56 of those companies. For the purpose of the survey, we considered the following actions as distracted: texting while driving, cell phone use while driving, non-electronic distracted driving and inattentive driving (a.k.a. cognitive distraction).
The survey posed five questions related to distracted driving. Below is a summary of the responses:
1. If an adverse action is taken, does your company treat all types of distracted driving infractions the same? The majority of the respondents (40) stated they treat all types of distracted driving infractions the same. Only five companies vary their approach. Comments could be grouped generally as:
- We do not rate for distracted driving yet, but it is under serious consideration.
- The type of distraction is not always known.
- Cell phone distraction may be more commonly cited on a report than other distractions.
- Distracted driving infractions are rated as “other moving violations” or “careless driving”.
2. Does your company apply points or debits (i.e., rating) for distracted driving? Of the 56 survey respondents, 36 stated they rate for distracted driving and give a higher rating for more recent infractions. One company gives the same rating regardless of timing. Examples of comments include:
- We assess points for distracted driving and then apply a flat fee if necessary.
- We treat the same as 20+ mph over the speed limit, points decreasing over time.
- Distracted driving is not specifically rated, but considered as an infraction, which may impact rating and/or preferred status.
- We have yet to see this on an MVR.
3. Does age of the applicant influence your rating for distracted driving? Respondents were generally split regarding the impact of age on rating for distracted driving. Of the 44 responses to this question, 24 said age is a consideration, while 20 stated that it was not. A few comments further explained the responses:
- Overall points and rating vary by age, but not differently for distracted driving.
- Overall rate is based on age of applicant.
- Inexperienced drivers considered in rating.
4. Does the gender of your applicant influence your rating for distracted driving? None of the responding companies rates distracted driving infractions differently by gender.
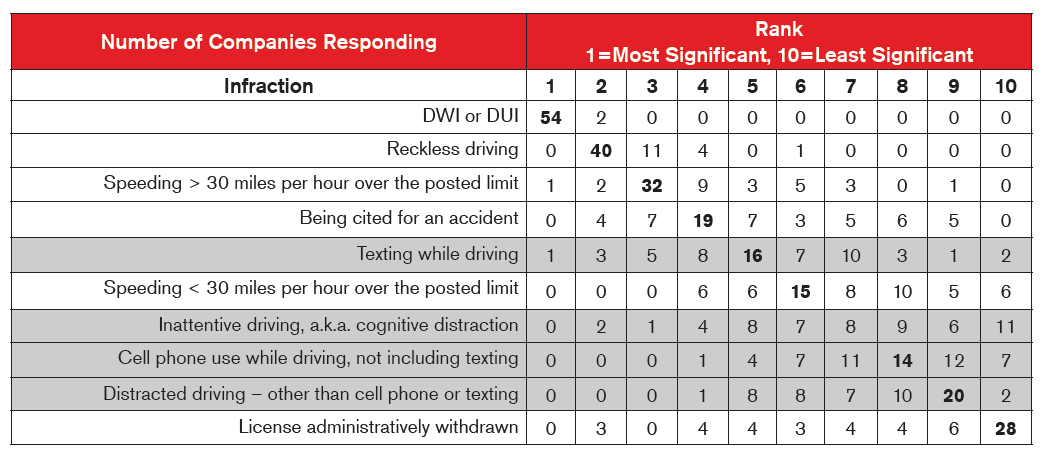
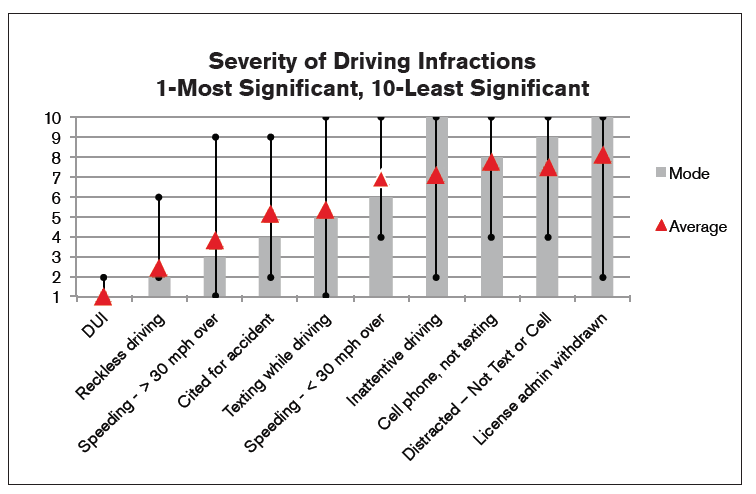
5. Respondents were also asked to rank the perceived severity of 10 driving infractions, including four related to driver distraction.
There was considerable variation in the responses from the 56 companies. However, the overwhelming majority of respondents cited DWI or DUI as the most significant. Generally, the distracted driving infractions (in gray) had the most variability in responses and were ranked toward the bottom of the list. Of the distraction-related infractions, texting while driving was most often considered more severe than cell phone use or other distractions.
Conclusion
Technological changes in the last decade have made cell phones with increasingly advanced functions an integral part of the daily lives of Americans. Cell phone use while driving – from talking on the phone to sending and receiving text messages – impairs a driver’s ability to safely operate a vehicle. Despite the risks, using a cell phone while driving is an increasingly common activity. Many efforts have been made to mitigate these risks; most states have some laws limiting cell phone use while driving.
This paper utilized data from the National Highway Traffic Safety Administration to better understand the role of driver distraction in fatal automobile accidents. We found younger people, especially younger females, are more often involved in fatal, cell phone-related accidents. Further, cell phone use has contributed to more fatal rear-end collisions. State laws restricting cell phone use appear to have mixed results in relation to fatal automobile accident experience. This supports the assertion that laws will only improve traffic safety if drivers change their behavior to avoid cell phone use while driving.
Experience from motor vehicle records indicates a higher all-cause mortality for individuals with a distraction-related driving infraction. The difference in relative mortality is greatest for younger people and declines with age. There is very little difference in experience by gender, though females have a higher relative mortality than males.
A survey of current underwriting practices in the United States revealed that distracted driving is currently a consideration in the underwriting process of many companies, though generally the type of distraction is not considered. Among companies that do not currently consider driver distraction in the underwriting process, many are considering this in the near future. Finally, even though companies often do not often differentiate infractions by the type of driver distraction, most underwriters consider a driving infraction resulting from texting to be more serious than other cell phone-related distractions.