Claims fraud has long been one of the most intractable risks for insurers. As companies strive to mitigate fraud, fraudsters continue to look for ways to exploit the claims process for maximum gain.
What does our survey tell us about claims fraud globally and what might we do to improve the detection and mitigation of fraud:
- 3-4% of all claims are fraudulent; or put another way, about 1 in 30 claims is identified as fraudulent
- Where underwriting controls appear strongest - North America - the incidence of claims fraud is reduced
- 37% of respondents never allege fraud, relying solely on the misrepresentation to deny the claim
- Of the fraud identified less than 2% resulted in a fraud prosecution
- Fraud investigation can extend the end to end time for consumers by up to 8 times the normal processing time
- Use of machine learning and in-force analysis as fraud detection tools are becoming common in regions with high incidence of fraud
- Respondents are split about future prospects for dealing with fraud; some see an improving picture driven by the use of innovation such as machine learning and in-force analysis, while others predict a deteriorating picture with data privacy and regulation limiting insurers’ ability to investigate fraud.
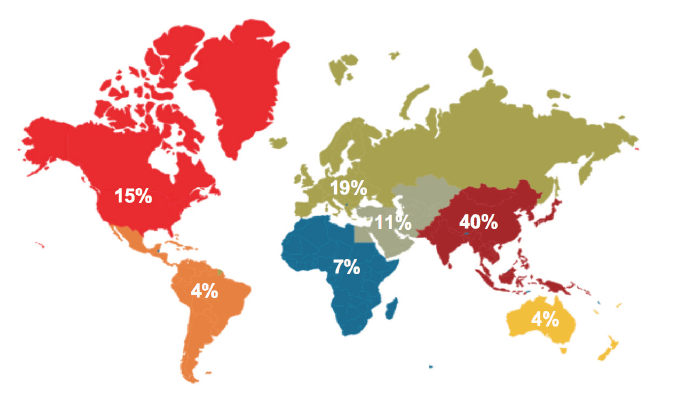
Global Responses
The 27 responding insurers represented the following regions: The Americas – North America and Latin America (19%); EMEA - Europe, Middle East and Africa (37%); Asia Pacific – Asia including Australia and New Zealand) (44%):
Incidence of Fraud
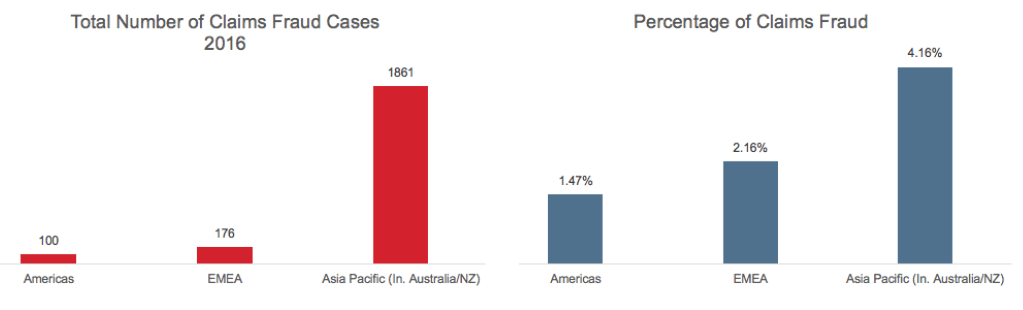
Claims Fraud
Survey results suggests that the global incidence of claims fraud is 3.58%, with high
claims fraud incidence in the Asia Pacific region. The Americas has the lowest
incidence of claims fraud at 1.47%, less than half the global average.
Figure 2
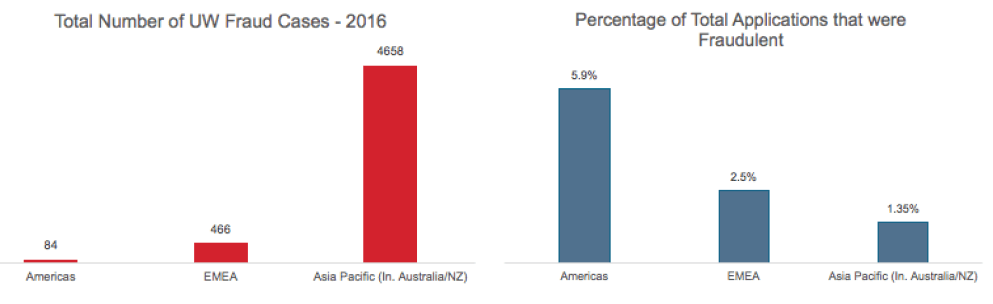
Underwriting Fraud
It is interesting to note the inversion from claims in terms of percentage, with higher proportions of underwriting frauds identified in the Americas. The average underwriting fraud percentage globally is 1.38% as reported by survey respondents.
Figure 3
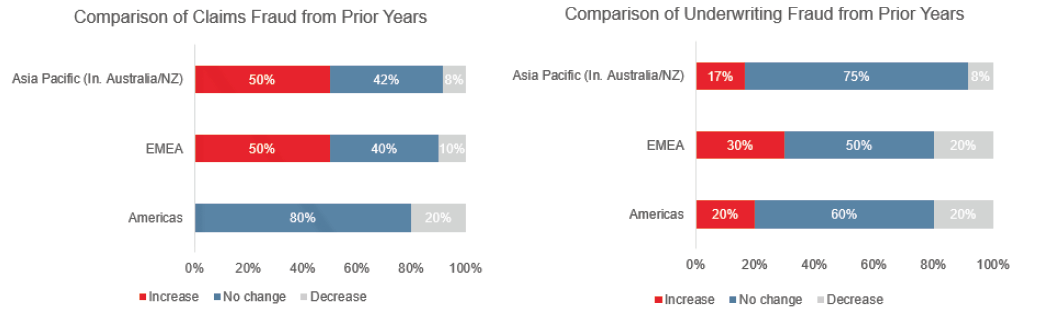
RGA noted that the incidence of fraud is stable with little change from prior years. In the Americas, none of the respondents reported an increase in claims fraud activity (see Figure 4 below).
Figure 4
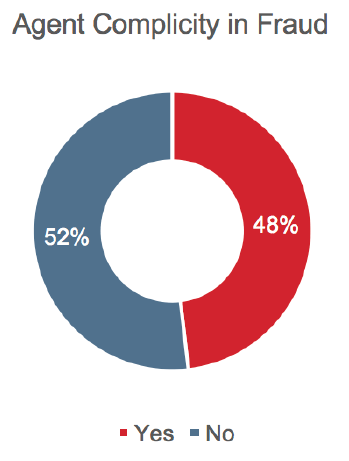
Fraud Assisted by Insurance Professionals
Nearly half of the companies (48%) surveyed have identified incidences of fraud assisted by agents, but overall the incidence of agent-assisted fraud is low, at less than 5% of identified fraud cases. Some insurers, however, reported a significantly different picture, with as much as 50% of their total fraud being assisted by agents.
Figure 5
Fraud assisted from within the life insurance companies is low, with only 7% of respondents indicating they have identified any worker-assisted fraud. Unsurprisingly, this is in the organized fraud category.
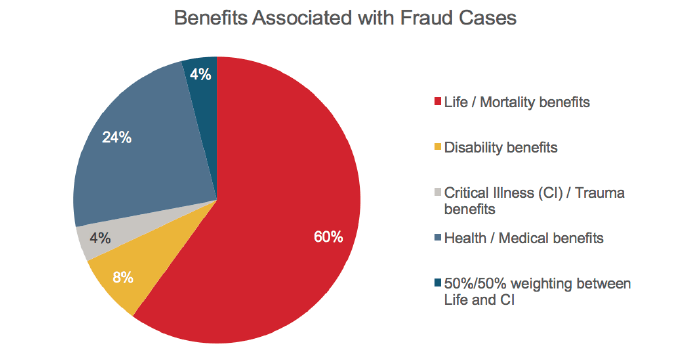
Spread of Fraud by Benefit Type
Perhaps surprisingly, mortality benefits were identified as most prone to fraud, with the highest incidence (60%). This may be related to the overall volume of mortality benefits written and the higher sums assured available. Health benefits were reported as the next most prone for fraudulent activity at 24%, followed by living benefits comprising just 10% of the overall claims fraud identified. It is important to note that this relates to all fraud, including underwriting fraud.
Figure 6
The Americas region has the lowest level of identified claims fraud but the highest level of identified underwriting fraud. This inversion might suggest that tighter underwriting fraud controls would give rise to better claims outcomes globally. This may also explain why The Americas is the only region not seeing evidence of increasing claims fraud.
Agent-assisted fraud continues to be a problem for some insurers but is in general a low level problem, with only around 5% of total fraud cases identified. Survey results revealed no real indication that fraud is assisted by other insurance professionals.
Identifying and Measuring Fraud
93% of respondents indicated that they have no minimum value for fraud investigation; meaning that when fraud is suspected, it is fully investigated.
The majority of the responding companies have created separate fraud investigation units. These tend to be small (one to three people) but some have dedicated teams as large as 10 people. Companies without dedicated teams frequently have individuals in their claims teams who specialize in fraud investigation (i.e., a team within a team). A small number of companies have no specific reference point for suspected fraud cases.
The approach to fraudulent claims tends to be the same regardless of how it arises. However, there are one or two countries where organized fraud is a significant problem. In these countries, attempts are made to identify organized fraud early in the process so that law enforcement agencies can be informed.
The majority of respondents have documented fraud indicators embedded in their claims processes. The most common are:
- Early claims
- Inconsistent documents/statement
- Overseas death
Other indicators of interest:
- Application information inconsistent with social media
- Applying for high face value
- Applicant’s name found on a local terrorist list
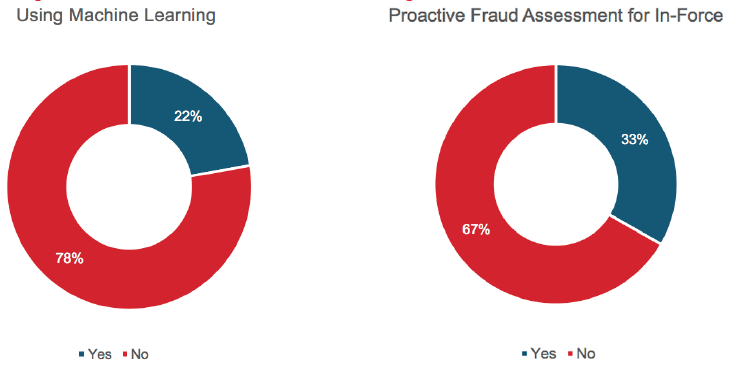
Machine or expert learning is used by 22% of respondents to identify potential fraud. This is more common in the Asia Pacific region – particularly in markets with higher incidences of fraud. In addition, about one-third of respondents analyze their in-force book to identify fraud prior to a claim arising. Again, this tends to take place in markets where incidence of fraud is high.
40% of participants from Asia Pacific and the Americas analyze the in-force portfolio. EMEA lags the rest of the world, with only 10% using machine learning or in-force analysis to mitigate fraud.
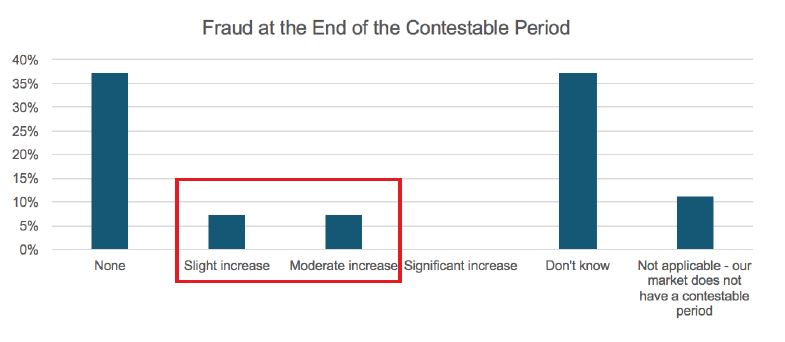
For markets that have a contestable period1 there is little evidence that the incidence of fraud increases at the point the contestable period ends. Fourteen percent of survey respondents indicated a slight (7%) or moderate (7%) increase in fraud.
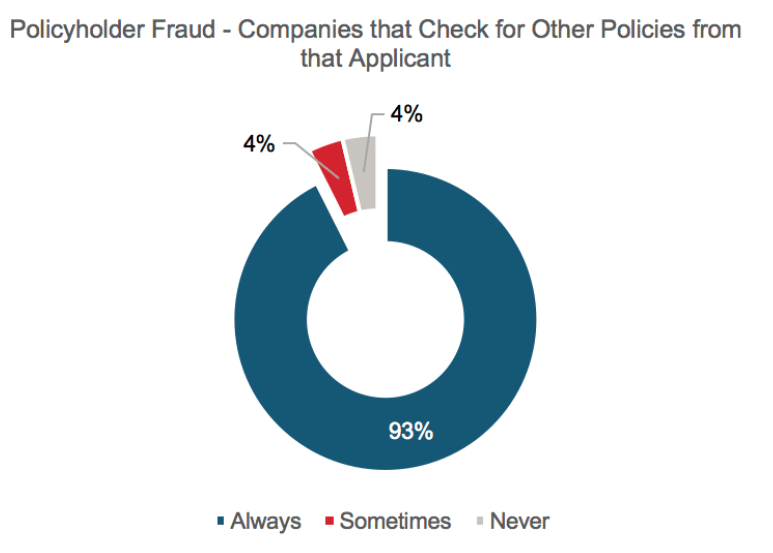
Almost all respondents reported that they would look for other policies held by the insured if fraud is suspected, with only 4% indicating that this was never considered.
The use of machine learning and in-force analysis is limited, and is most prevalent in countries with high incidence of fraud. There is potential here for other markets to use these techniques to identify and or remove fraudulent policies before a claim arises.
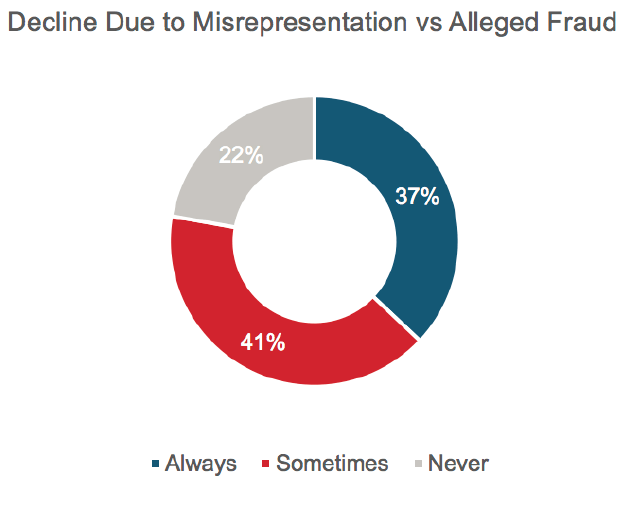
Reporting and Enforcement
37% of survey respondents indicated they would always “decline” a case where misrepresentation was a factor rather than allege fraud. Only one in five indicated they always allege fraud where this is “‘proven” on the evidence they hold.
Figure 11
Only one in three insurers indicated they would always contact law enforcement in the case of fraud, while 7% indicate they would never involve law enforcement.
Figure 12

Among the participants that reported successful prosecutions for fraud cases there were 36 successful prosecutions, which represents just 1.7% of the fraud cases identified. The majority of successful prosecutions pertained to health and living benefits, with a total of 23 cases reported.
The involvement of the reinsurer in claims involving fraud is normally a treaty requirement. 96% of respondents indicated they “sometimes” or ”always” involve the reinsurer in the final actions required in relation to fraud claims.
Based on the difficulty of proving fraud and the time and effort required to successfully prosecute, the number of prosecuted cases is low. Are insurers that decline on the basis of misrepresentation rather than allege fraud taking the right approach? There seems to be a negative cycle: ”We won’t win so we won’t prosecute.”
Impact on Consumers
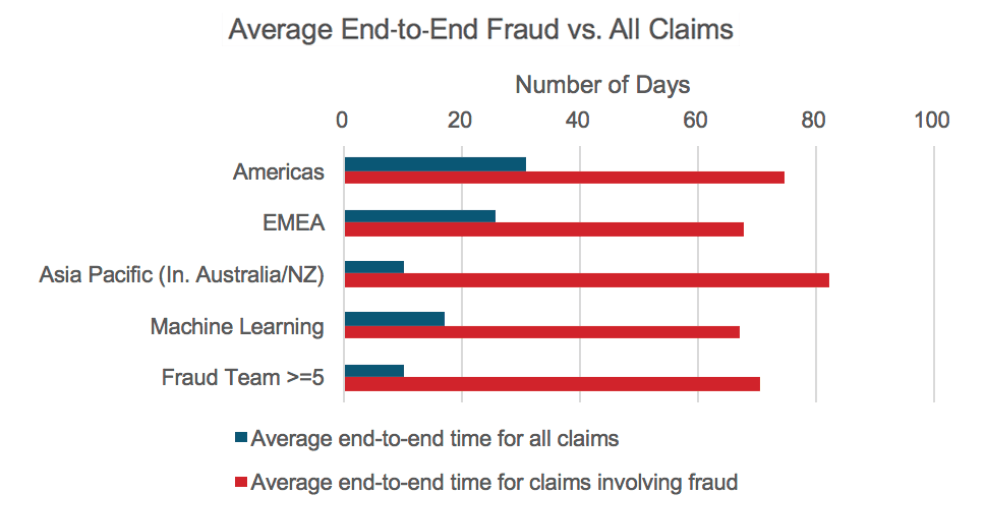
It is important that we investigate all cases of potential fraud, but what impact does this have on the consumer? The average end-to-end processing time for a case of suspected fraud takes up to eight times the normal end-to-end processing time.
The use of machine/expert learning in Asia, according to the respondents, reduces end-to-end time for cases involving fraud by 15 days (20%). For insurers with large fraud teams there is also a reduction in the end-to-end processing time for fraud of 12 days (15%). However, in general, the end-to-end time for fraud cases compared to all claims is still a significant multiple.
Our survey has identified that a case of suspected fraud can take up to eight times as long to process as other claims. Although some improvement in end-to end times can be seen from the use of dedicated fraud teams or machine learning, the fact remains that in most cases the final decision will be to decline the claim on the basis of misrepresentation rather than allege fraud. In these circumstances, might we question whether we are using the resources available to us in the most effective way?
Challenges
Survey respondents cited the following challenges and future expectations by region:
Figure 14
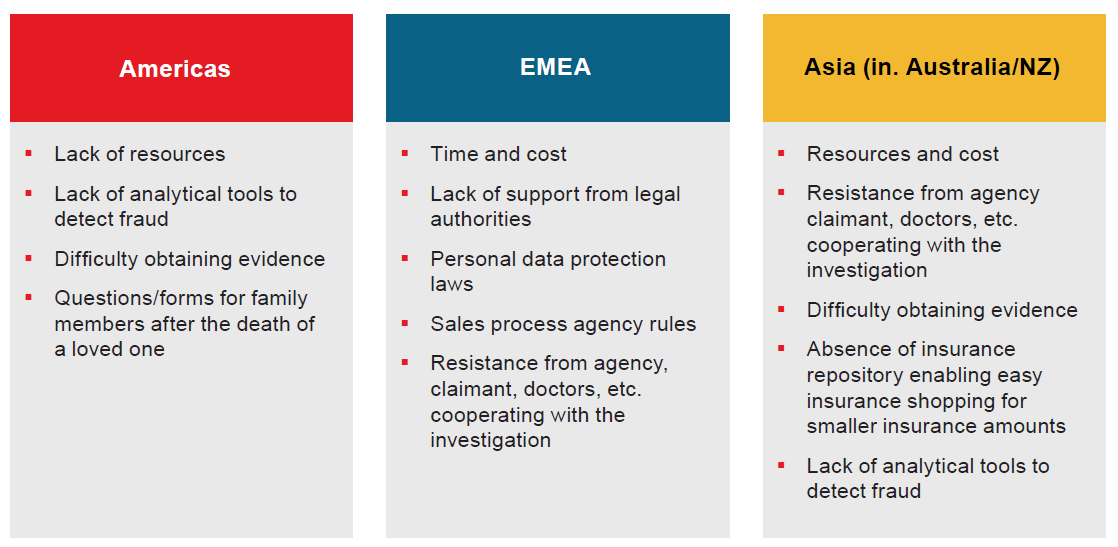
There are clear global themes emerging in relation to the challenges facing insurers. Time and cost are key factors, as well as resistance from third parties to assist the investigation process. Data protection laws and other regulations are also negatively impacting insurers’ ability to investigate fraud. In our 2016 survey, looking at the challenges facing claims management, we identified that a growing asymmetry of information between the insured and insurer could be a key challenge going forward.
Future Outlook
Predicting the future is always difficult, but it seems predicting the future of fraud is particularly so. Globally there is a roughly 50/50 split between those who see an improving picture and those who have a negative view. However, even in these groups, there was no commonality in terms of the reasons why the view was taken.
Here are some comment highlights, by region:
Figure 15
Americas | EMEA | Asia Pacific (Inc. Australia/NZ) |
As medical testing improves/ grows; we should be able to have tissue samples/blood samples that will definitively prove timing of non-prescription drugs being taken. | Negatively because this (fraud investigation) will be more regulated in the future | Data-sharing with related industries, including finance and health care, will have a positive effect on detecting insurance fraud. |
The use of machine learning and fraud indicators will assist (in detecting and mitigating fraud). | Positive: The advance in genetic studies and the availability of data. Negative: Laws restricting the use of personal information. | As an industry we are losing billions of dollars annually due to insurance fraud, detected and undetected. With sensitivity about this issue going up and the industry coming together to share data and information, we foresee a positive change happening towards combating this menace in the coming years. |
Some Final Thoughts
Life insurance fraud could, with some justification, be called the perfect crime. It is low in risk and has high reward potential. Even if the fraud is identified, the results of this survey demonstrate the extremely small possibility of incurring any form of penalty or punishment. There is also little appetite to prosecute due to high litigation costs and uncertain outcomes: less than 2% of fraud cases identified in this survey resulted in successful prosecutions.
Looking at the results of this survey, readers might conclude that, given the scale of the issue, fraud should be a cause for concern in the Asian market in particular. With the scale of the incidence reported in that region, the action taken by insurers would in some cases appear inadequate, ranging from even challenging fraud when it is identified to taking legal action to prevent it in future.
What can insurers do? The answer would appear to be prevention; i.e., use our limited resources to identify fraud before a claim arises. This might mean strengthening our underwriting controls, or involving machine learning and continuous assessment of in-force books to identify and investigate high-risk policies. India has to date led the market in portfolio analysis to identify potentially fraudulent policies. We would encourage other markets to look closely at what has been done in India and to adopt similar approaches.
Hopefully, as our industry hones our fraud prevention capabilities and improves our detection tools with education, fraud scoring analytics and/or machine learning, we will cause fraudsters to pause and deter them overall.