New biomarkers are constantly being discovered and research continues into their application in clinical practice.
Not all biomarkers can be used as screening tools for insurance purposes, but they can still provide useful information within a blood profile when assessed at underwriting stage and must not be discounted. It is important that biomarkers are properly interpreted and that the underwriter understands the data presented and how it affects the overall risk profile.
What is proPSA?
Due to the inherent problems with prostate-specific antigen (PSA) values and false positive results, several new biomarkers for prostate cancer (PCa) have been discovered in recent years. These include p2PSA, a prostate cancer-specific
isoform of free PSA (fPSA), which is more concentrated in peripheral gland cancer tissue and is almost solely expressed by prostate cancer cells3. It is also notably higher in patients diagnosed with PCa1.
There is a need for new biomarkers not only to identify early prostate cancer but also the more aggressive cancers for which treatment is most beneficial. So far, studies have shown that p2PSA rises with increasing Gleason scores (GS) and is higher in aggressive cancers 8.
Further to this, the U.S. Food and Drug Administration has approved the Prostate Health Index (PHI), which incorporates p2PSA, fPSA and total PSA (tPSA) with the formula [(p2PSA/ fPSA) x √(tPSA)]4. The PHI has been shown to be 2.5 times more specific in detecting prostate cancer in patients with PSA values in the 4-10 ng/mL range, resulting in a 31% reduction in unnecessary biopsies2. Both p2PSA and PHI have also been found to be the only raised biomarkers in those with PSA < 4 ng/mL and a negative digital rectal exam (DRE) several months before a diagnosis of PCa is made3.
The following evidence supports the association between these new biomarkers and Gleason scores greater than or equal to 7, with PHI additionally found to be a useful clinical marker for men with a family history of prostate cancer1:
- Catalona et al. showed %p2PSA (p2PSA/fPSA x 100) significantly improved specificity for PCa for PSA in the 2-4 ng/mL range, identifying 90% of cancers including all extra-capsular tumors and 96.6% with GS > 71.
- Sokoll et al. examined data from 119 men with PSA 2.5-4 ng/mL, and found that at a sensitivity of 75%, specificity for %p2PSA was considerably greater than for %fPSA (59% v. 33%)1.
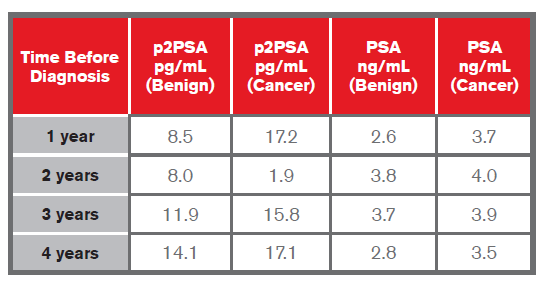
- Heidegger et al. showed that p2PSA was able to distinguish aggressive PCa from benign conditions one to four years before diagnosis in Caucasians in their early 60s, with the highest predictive values at one to two years5, as shown in the table below. They also found that preoperative p2PSA values were significantly higher in PCa with nodal involvement (> T3a) compared to men with organ-confined cancer (< T2c) in years 1, 2, 3 and 4 before diagnosis. Levels were highest for those with GS > 8 and lowest for those with GS < 65.
- A study by Mikolajczyk et al. of 380 men with PSA 4-10 ng/mL showed that p2PSA, with a sensitivity of 90%, would have resulted in 36% fewer biopsies1.
- In a multicenter European study by Lazzeri et al. of patients with a total PSA of 2-10 ng/mL, PCa was diagnosed in 40.1%. The %p2PSA and PHI were found to be the strongest predictors of PCa at initial biopsy, being significantly more accurate than PSA or %fPSA. At a PHI cut-off of 28.8, 116 biopsies could have been avoided, with PCa overlooked in six cases but none being GS > 76.
These studies would indicate a close correlation between higher values of p2PSA and a diagnosis of prostate malignancy. PSA is organ- but not cancer-specific, and can be raised in the presence of benign prostatic hyperplasia (BPH), in genitourinary infections or post DRE1. A second problem with PSA values is its low specificity (below 10 ng/ mL), where cancer is still detected in up to 25% of patients, with an even higher percentage of patients undergoing needless biopsy4. Treatments for indolent cancers can lead to complications such as urinary incontinence, erectile dysfunction and/or hormonal changes5.
In 2012, the United States Preventive Services Task Force issued a Grade D recommendation (“discourage the use of this service”) against prostate cancer screening for men of all ages. While there would be one fewer prostate cancer death for every 1,000 men screened, there would also be 30-40 men with subsequent incontinence or erectile dysfunction7.
The Melbourne Consensus Statement, created by a group of international experts and the European Association of Urology, recommended baseline screenings of men in their 40s, but also stated that PSA testing should not be considered on its own but as part of a multivariable approach to prostate cancer detection7.
Most recently, in October 2014, the Canadian Task Force on Preventative Health Care recommended against screening using the PSA test in the general population, based on the harms outweighing the benefits of a 0.1% reduction in deaths due to prostate cancer using screening.
What is Red Cell Distribution Width (RDW)?
Red cell distribution width is a measure of the variation in the size of circulating erythrocytes that can help to identify causes of microcytic anemias such as iron deficiency and thalassemia trait and of macrocytic anemias due to B12 or folate deficiency and bone marrow disorders.
RDW is reported either as coefficient of variation (CV) or standard deviation (SD). RDW-CV (%) is calculated by (standard deviation of RBC/mean MCV) X 10010. A normal RDW-CV reference range is between 11% and 14.5%11. A high RDW, known as anisocytosis, can be caused by thalassemias or iron deficiency. A higher RDW is also associated with older age and impairments such as diabetes, heart failure and chronic kidney disease12. RDW has also been investigated as a predictive marker for risk of myocardial infarction (MI) and in the progression of some cancers. Higher RDW values so far appear to have a linear relationship with increased comorbidities and mortality in patients with coronary artery disease. Studies below also show that increased RDW is associated with an increase in all-cause mortality.
- 2,550 patients from the National Health and Nutritional Examination Survey III group (NHANES III) were grouped into quartiles of RDW <13.1%, >13.1%
-<13.6%, >13.6% -<14.1% and > 14.1%. Mortality in Q4 with the highest RDW values was nearly four times higher than that of those in the first quartile12. - An evaluation of seven community-based studies by Patel et al. in 2009 found that when compared to an RDW of <12.5%, mortality risk was nearly double for those with RDW 14% - 14.9% (HR 1.77, 95% CI 1.53-2.04) and more than double for those with RDW >14.9% (HR 2.51, 95% CI 2.1-2.91). Mortality risk increased by 14% for every 1% increase in RDW (HR 1.14, 95% CI 1.11-1.17)13.
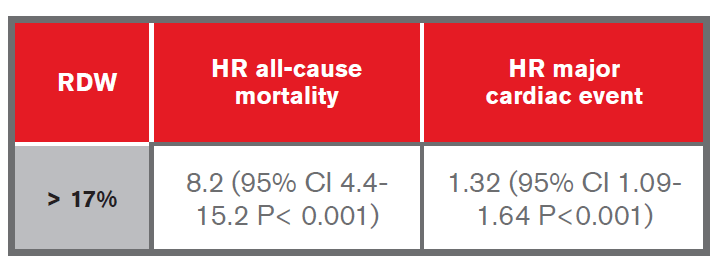
- A study by Arbel et al. evaluated the predictive value of RDW for cardiovascular morbidity and all-cause mortality over a five-year period, using data from a cohort of a quarter of a million patients. They found that compared to patients with RDW < 12%, a significant association with increased morbidity and mortality occurred as follows9:
- A retrospective study by Spell et al. on cases of colon cancer diagnosed over a five-year period found that of the 127 patients diagnosed with right-sided colon cancer, 84% had elevated RDW, and of the 98 with leftsided colon cancer, only 50% had elevated RDW15.
- The Tromsø Study looked at whether RDW was associated with the risk of a first MI. During the 15-year followup of those who had experienced a first MI, each 1% increment in RDW was associated with a 13% increased risk of a second MI (HR 1.13, 95% CI 1.07-1.19). Those with an RDW greater than the 95th percentile had a 71% higher risk of MI than those who placed in the lowest quintile (HR 1.71, 95% CI 1.34-2.2). It also showed that the risk of CV mortality increased by 22% for a 1-SD increase of RDW (HR 1.22 95% CI 1.14- 1.31), and was more than twice as high for those in the highest quintile when compared to the lowest14.
Based on studies to date, an independent relationship has been shown to exist between higher RDW values and the risk of cardiovascular events. However, larger studies would still be needed to evaluate fully the usefulness of RDW as a biomarker in this context.
What is Cystatin C?
Cystatin C is a protein found in all nucleated cells in the blood. It is filtered by the glomeruli in the kidneys, with almost all being reabsorbed within the proximal tubules. When renal function is reduced, these proteins accumulate in the blood. The more commonly measured creatinine is a byproduct of muscle cells and is influenced by muscle mass, physical activity and diet as well as by age and gender. Kidney disease disproportionately affects the elderly as kidney function declines over time, and cystatin C has been shown to be more sensitive than creatinine in detecting mild to moderate reduction in estimated glomerular filtration rate (eGFR). It is also released into the bloodstream at a relatively consistent rate and holds a significant advantage over creatinine in that it is not influenced by age, gender, race, muscle mass and/or most medications16.
In 2007, the European Society of Cardiology recommended the use of cystatin C for predicting MI and long-term mortality in patients with non-ST elevation acute coronary syndrome17. The NHANES III study reported that cystatin C-based estimation of renal function was more strongly associated with all-cause mortality as well as with cardiovascular mortality than creatinine-based estimation of renal function 22. Furthermore, high levels of cystatin C have been associated with poorer outcomes in those diagnosed with colorectal, lung and melanoma cancer, and patients with relapse of B-cell non-Hodgkin’s lymphoma were found to have significantly higher levels than those without recurrence21. The prognostic power of cystatin C is further illustrated in the following studies:
- The Tromsø Study found that cystatin C was a risk factor for all-cause mortality in women. A 38% increased risk for all-cause mortality was found when the upper cystatin C quartile was compared with the lowest, after adjustments for cardiovascular risk factors. Interestingly, this association was not found in men22.
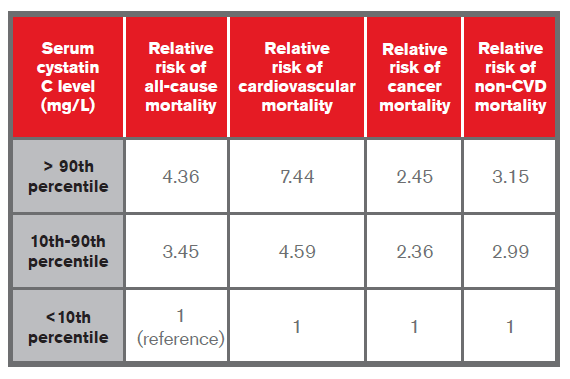
- The NHANES III study looked at cystatin C levels in those 60 years of age and in a 25% random sample in those between 12 and 59 years of age. Those with high cystatin C were found to be mostly male, hypertensive and older lives. When comparing participants with low values to those with medium or high levels of cystatin C, the study showed that they were at higher risk of all-cause and cause-specific mortality. A sample of data is provided in the table below23:
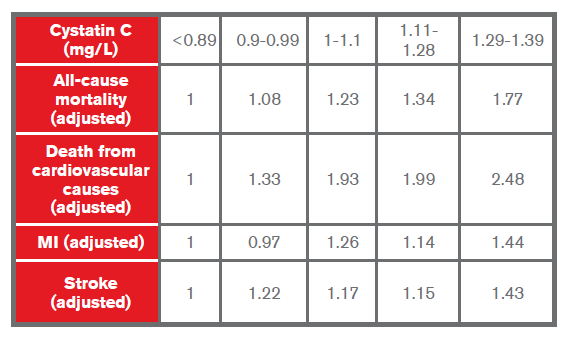
- A study by Shlipak et al. published in 2005 on cystatin C in elderly patients found it to be a stronger predictor than creatinine of the risk of death and cardiovascular events. The hazard ratios were found to be as follows20:
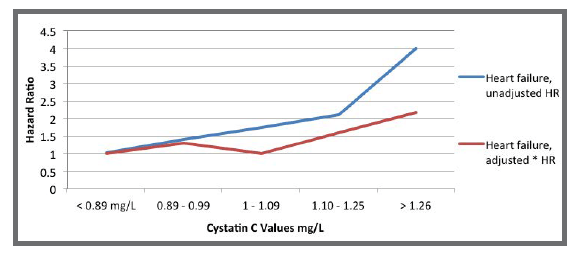
- A study by Sarnak et al. of the Cardiovascular Health Study found that participants in the higher quintiles for cystatin C were more likely to be white, older, have a history of hypertension and coronary heart disease (CHD), higher triglycerides and lower HDL cholesterol. Those in the highest quintile were also associated with a four-fold risk of heart failure in univariate analysis and twice the risk when adjusted for multivariate risk factors18 (see chart below):
- The Cardiovascular Health Study, funded by the National Heart, Lung and Blood Institute (NHLBI) in 2005, found that the 20% with the highest levels of cystatin C had a two-fold risk of death from all-cause mortality as well as CAD and a 50% higher risk of MI and stroke compared to those with the lowest levels of cystatin C17.
Cystatin C is a more useful tool than creatinine in the detection of mild renal dysfunction where eGFR is measured at >60 mL/min/1.73m17 and thus its use might be considered in underwriting where there is some question about renal function22. It is important to note, however, that levels of cystatin C may be altered by rapid cell turnover, uncontrolled thyroid disease or corticosteroid use, so this must be factored in when assessing test results for underwriting purposes19. In addition, the cost of the cystatin C test (US$4.00) is substantially more than that of creatinine ($0.20), but it is still cheaper than other frequently-ordered clinical tests such as BNP ($15.00) or Troponin T ($10.00), so cost should not be a prohibitive factor when considering cystatin C’s use as a biomarker when developing underwriting assessments19.