In 2013, RGA and TransUnion began research into the protective and predictive nature of credit for the purpose of understanding relevance to mortality risk.
Similar to the protective value analysis RGA completed on other key data sources used in life insurance underwriting, such as motor vehicle records and prescription drug scoring, RGA’s goal was to understand the relationship of credit to mortality outcomes. Given credit data’s long- term use in analyzing risk in adjacent markets like property and casualty insurance, it appeared to be an ideal data point to explore for the life insurance market.
In 2014, a production version of a credit-based insurance score, branded TrueRisk® Life, was finalized by TransUnion. In an effort to validate the model, sample data of roughly 18 million individuals over a 12-year period was studied by RGA to understand the long-term mortality implications of knowing the TrueRisk® Life score at the time of issue. The study showed significant mortality segmentation, ultimately being the catalyst for further direct life insurance carrier studies.
Since that time, the TrueRisk® Life model has not only been proven on general US population data, but it has been proven across 15 million life insurance policies, in some cases going back more than 10 years. Predictive value is continually shown across mortality, as well as demonstrating correlations to persistency, fraud/rescissions, smoking habits, agent behaviors, and others. With its predictive nature and single source of data wrapped with the theme of simplicity and transparency, TrueRisk® Life has become a tool to enable improved mortality risk segmentation and the simplifying and expediting of the underwriting process, removing friction, pain, cost, and time.
Limitations
This document intends to explain the methodology used by RGA for evaluating TrueRisk® Life. The information contained in this document is confidential and may not be distributed, disclosed, copied, or otherwise furnished to any third party without the prior consent of RGA. Nothing included in this document may be used in any filing with any public body, such as, but not limited to, the Securities and Exchange Commission (SEC) or state insurance department without prior written consent from RGA. RGA, its directors, officers, and employees disclaim liability for any loss or damage arising or resulting from any errors or omissions in this analysis and summary of the results or any other information contained herein. The report is to be reviewed and understood as a complete document. The results and conclusions presented in this report are not meant to substitute RGA’s actuarial judgment for that of any company. This document includes methodology that can be used to evaluate the validity and usefulness of TrueRisk® Life. Other methods may be used. Actuarial judgment does apply. RGA relied on data supplied by TransUnion. Primary data relied upon includes holdout population data sample with TrueRisk® Life score appended.
Why Credit Data
Credit reports have long been utilized by life insurance carriers for financial underwriting. Before leveraging credit data for additional uses, a few questions had to be answered to ensure that the resulting model and underlying data could be applied within current and future life insurance underwriting processes. Below are the key criteria documented as a result of these questions:
- Underlying data and similar approaches are utilized in adjacent markets
- Data is heavily regulated and has processes in place for consumer dispute resolution
- Data is updated in near real time, reducing the risk of outdated information at time of use
- Model is developed and fit for purpose – to solve for mortality
- Model is based on a large, credible population allowing for a separate holdout sample to be externally validated
- Data is available for vast majority of adult population
TrueRisk® Life Model Development
For the development of TrueRisk® Life, TransUnion started with the total credit-active population from 1998, which represented 90% of the adult population in the United States at that time. Deaths were appended using the 2011 version of the Social Security Death Master File.
The process began with about 175 million people from each of the four quarterly archives of the 1998 credit- active population. From those archives, a non-overlapping sample of about 44 million (or 175/4) was drawn from each of the four archives.
Those with missing or invalid Social Security numbers, and those with no credit history, were removed from the data. Similarly, those under age 20 or over 70 were also excluded due to limited information. These exclusions resulted in nearly half of the data being removed, leaving TransUnion a total of 92 million records, divided as follows:
- 44 million records were used as training data to create the model. The model was calibrated to population deaths over a 12-year period (1999-2010).
- 30 million records were used by TransUnion to test and validate the model on an independent dataset and to avoid over-fitting the model
- 18 million records were used as a holdout, de-personalized sample provided to RGA for the mortality study validation process
TransUnion data scientists started with more than 800 credit attributes, as well as control variables such as age, gender, and state. Using variable-clustering techniques and one-way lift chart analysis, the long list of variables was reduced to approximately 130 variables for modeling purposes.
TransUnion fit a series of multivariate logistic regression models to the training dataset with mortality as the target variable. The final model consists of 25 credit attributes that quantify behavioral risk and are generally assigned to one of the following four categories:
- Credit-seeking activity (e.g., recency and frequency of credit inquiries and trades)
- Credit tenure (e.g., length of credit history, active trade count, months since oldest trade, etc.)
- Severity and frequency of derogatory credit information (e.g., bankruptcies, collections)
- Credit usage (e.g., utilization percentages, usage patterns, recency)
TrueRisk® Life is subject to the strict guidelines of the Fair Credit Reporting Act (FCRA), federal legislation that governs the collection, assembly, and use of consumer report information. The model does not use credit card transactions, social media, income, race, criminal records, court filings, property records, religion, national origin, IRS data, education, or checking and savings account information.
Model results were tested for stability and statistical significance on the 30 million record test data. The variables selected for the final model were those with low correlation and those containing the most predictive power for mortality. The variable selection also looked for attributes that were stable over time and non- gameable.
The final TrueRisk® Life model score is transformed into a nearly uniform scale from 1 to 100, with each number representing about 1% of the U.S. population. A score of 1 represents the lowest mortality risk, and a score of 100 represents the highest mortality risk. The output of the scoring algorithm was appended to the 18 million records provided to RGA for validation and research purposes.
TrueRisk® Life Model Validations: U.S. Population Validation Study
Data
RGA started the validation process with the holdout sample of 18 million individual lives provided by TransUnion from the 1998 credit data archives. Data included archive date, month/year of birth, gender, state of residence, date of death, and the TrueRisk® Life score as of the archive date.
Since gender is not commonly available in credit data, TransUnion used a prediction algorithm based on an individual’s name to populate the gender field so RGA could perform traditional mortality analysis. Only those whose gender could be predicted with 90% confidence were included in the data and assigned the gender most common for the name.
Approximately 25% of the original 18 million lives came from each quarter of the 1998 archives. Quarterly data was used to help control for seasonality, as an individual’s credit profile can change slightly during the year.
Approach
From the data received, RGA created a 12-year (1999-2010) traditional actuarial mortality study on the 18 million lives. The following data was excluded from the study:
- Individuals with an unknown gender
- Individuals aged 70 and above in 1998
- Individuals living outside of the 50 states
The mortality study resulted in 194 million exposure years and 1.1 million deaths.
Expected Mortality Basis
The base mortality tables used in the study are the 1999-2010 historical U.S. Population mortality tables (by calendar year, gender, and attained age). Before applying these tables to the data, a few basic adjustments were made to the tables:
Factors were applied to mortality rates (q’s) to adjust for under-reported deaths in the Social Security Death Master File. Additional factors varying by attained age and calendar year were also applied.
Mortality rates by gender were blended (95% / 5%). Essentially, the rates used for females were 95% of the female rate and 5% of the male rate and the rates used for males were 95% of the male rate and 5% of the female rate. This seemingly appropriate actuarial adjustment was an attempt to recognize that the procedure used to assign gender was not perfect.
Results
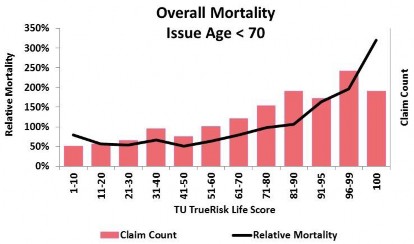
The overall study results, containing over 1 million population deaths, are presented graphically in Figure 1. The red line shows the raw actual-to-expected deaths (A/E) mortality results, expressed as a percentage of historical U.S. population mortality. The overall mortality of the credit-active population is approximately 96% that of the U.S. population.
The TrueRisk® Life model produces an A/E curve that is smooth and monotonically increasing. As shown in the graph, the worst 5% of risks has an A/E more than six times that of the best 5%. The worst 10% has an A/E of about five times that of the best 10%. These results were validated across many dimensions and the TrueRisk® Life Score was shown to consistently provide significant mortality segmentation.
Figure 1: Overall Population Mortality Results
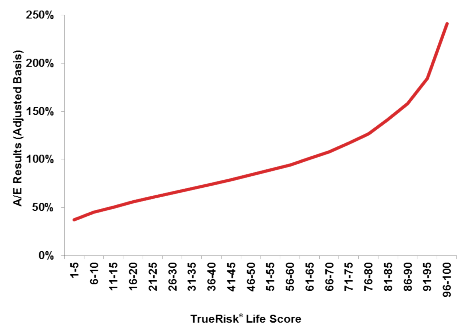
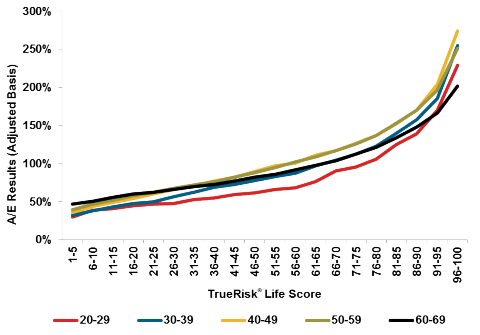
Figure 2 shows the results by the age the individuals entered the study in 1999.
All age groups show significant mortality segmentation across the scores. The older a person gets, the more likely they are to have a credit history. Those with a credit history generally demonstrate better-than-average mortality relative to the overall population. The increasing prevalence of credit data as people age results in the parallel shift in the curves demonstrated in the graph.
Behavioral-related mortality is dominated by health factors at the oldest ages, so the age group 60-69 is a bit flatter than observed in younger groups.
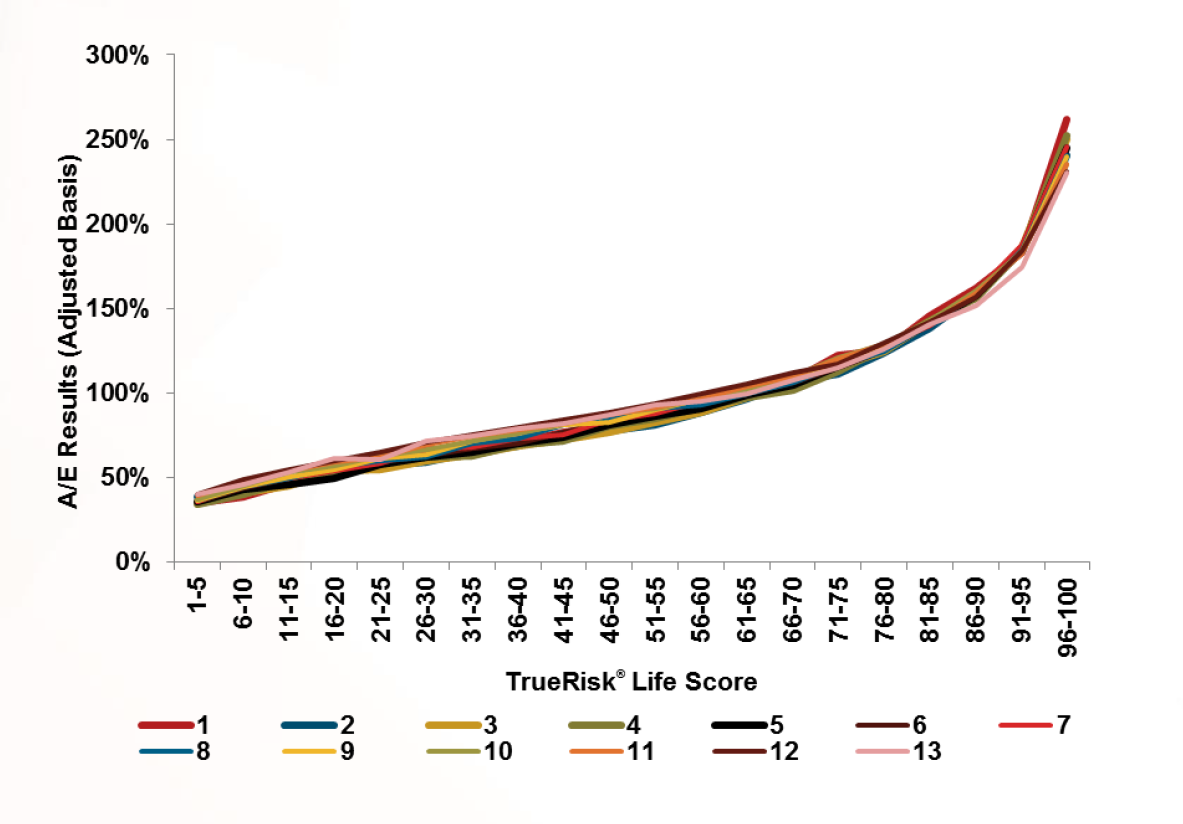
Credit data was pulled on all individuals at some point during 1998. The results by duration since the data archive date are shown in Figure 3. The results are remarkably similar for all durations in the study. The mortality segmentation does not appear to wear off over time. If later durations (10+) are compared to early durations (1-3), a small shift in results might suggest that later durations do appear to flatten slightly, but not much.
Figure 2: Mortality by Age at Entry
Credit data was pulled on all individuals at some point during 1998. The results by duration since the data archive date are shown in Figure 3. The results are remarkably similar for all durations in the study. The mortality segmentation does not appear to wear off over time. If later durations (10+) are compared to early durations (1-3), a small shift in results might suggest that later durations do appear to flatten slightly, but not much.
Figure 3: Mortality by Duration since Archive Date
U.S. Insured Lives Validation Studies
Background
The TrueRisk® Life model and U.S. Population Validation study were first presented at a Society of Actuaries meeting in 2014. Beyond the population validation, completing a retrospective analysis and understanding the impact on insured lives was critical to determining the true value of TrueRisk® Life to the life insurance industry.
Once production ready, the first TrueRisk® Life client validation was completed in early 2015. To complete the validation study, the carrier sent inforce insured data directly to TransUnion where the scores were calculated near the time of issue for each policy and appended to the carrier data. TransUnion then provided de-identified data to RGA to conduct independent mortality and lapse studies.
The focus of the first TrueRisk® Life carrier validation was mortality analysis of both fully underwritten business (term, universal life, variable universal life) and non-medically underwritten business (whole life plans under $100,000). This analysis will be highlighted briefly in this paper.
Since the original insured lives validation study, RGA has completed approximately 40 studies on more than 15 million life insurance policies. Individual carrier results vary, but significant mortality segmentation has been observed in all of the business studied. For a better understanding of how TrueRisk® Life impacts mortality and persistency, each carrier is encouraged to conduct its own independent review of the score.
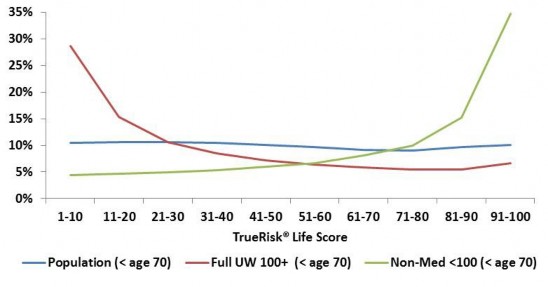
When looking at the distribution of scores by product in Figure 4, the benchmark population distribution is nearly uniform since each TrueRisk® Life score represents approximately 1% of the U.S. population. The graph shows a much larger percentage of the total business at the lower scores for fully underwritten business and a much larger percentage of the business at the higher scores for non-medical business.
Figure 4: Distribution of Scores by Product
When creating the insured lives calendar-year mortality studies, the study period covered 2002-2013 using 2008 VBT tables as the expected basis. The insured lives anniversary-year lapse studies also focused on 2002-2013. Both studies are reported on a count basis with relative lapse and mortality results reported. Finally, issue ages are restricted to less than 70 and face amounts are restricted as explained in the following sections.
Fully Underwritten Business
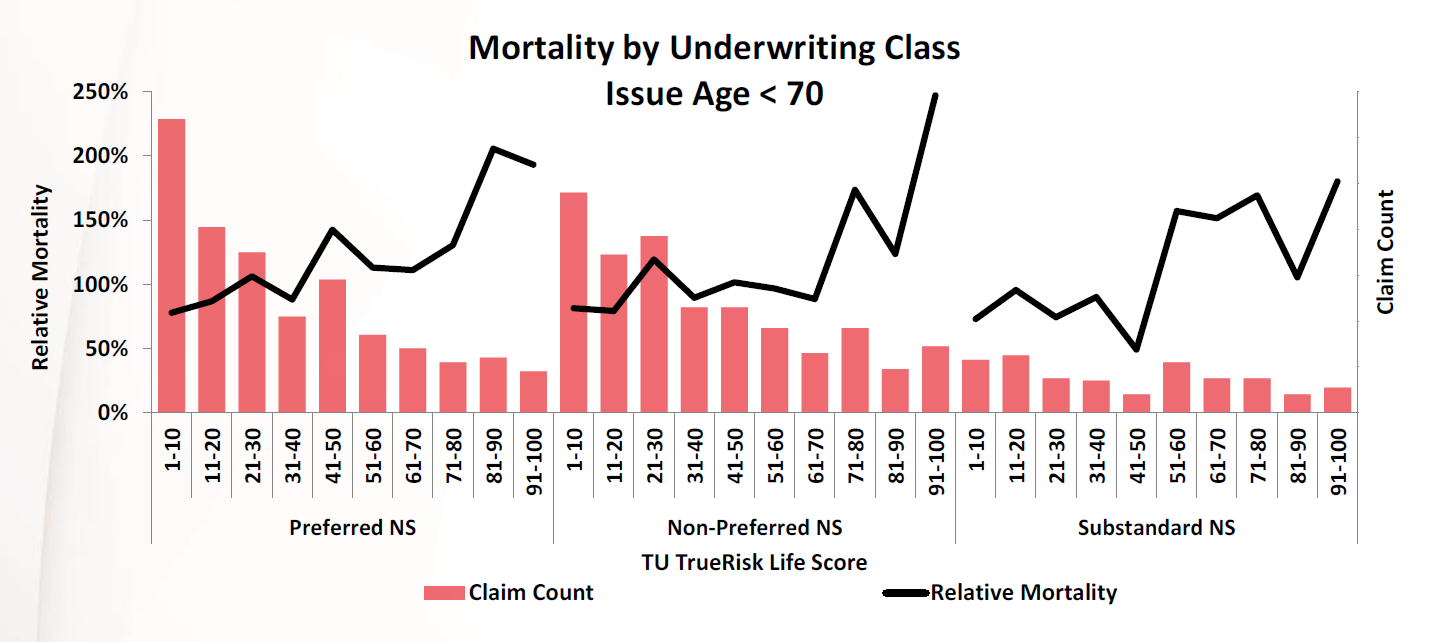
This section covers term, UL and VUL business with face amounts of $100,000 and up. The mortality results by TrueRisk® Life score for the non-smoker risk classes are shown in Figure 5. Relative mortality within each risk class are displayed. Results show that those policies with the worst TrueRisk® Life scores (>70) have about 2.6 times the mortality of those with the best TrueRisk® Life scores (<10). Additionally, TrueRisk® Life provides further mortality segmentation on lives that have already undergone full medical underwriting.
Figure 5: Fully Underwritten Mortality Results by Risk Class
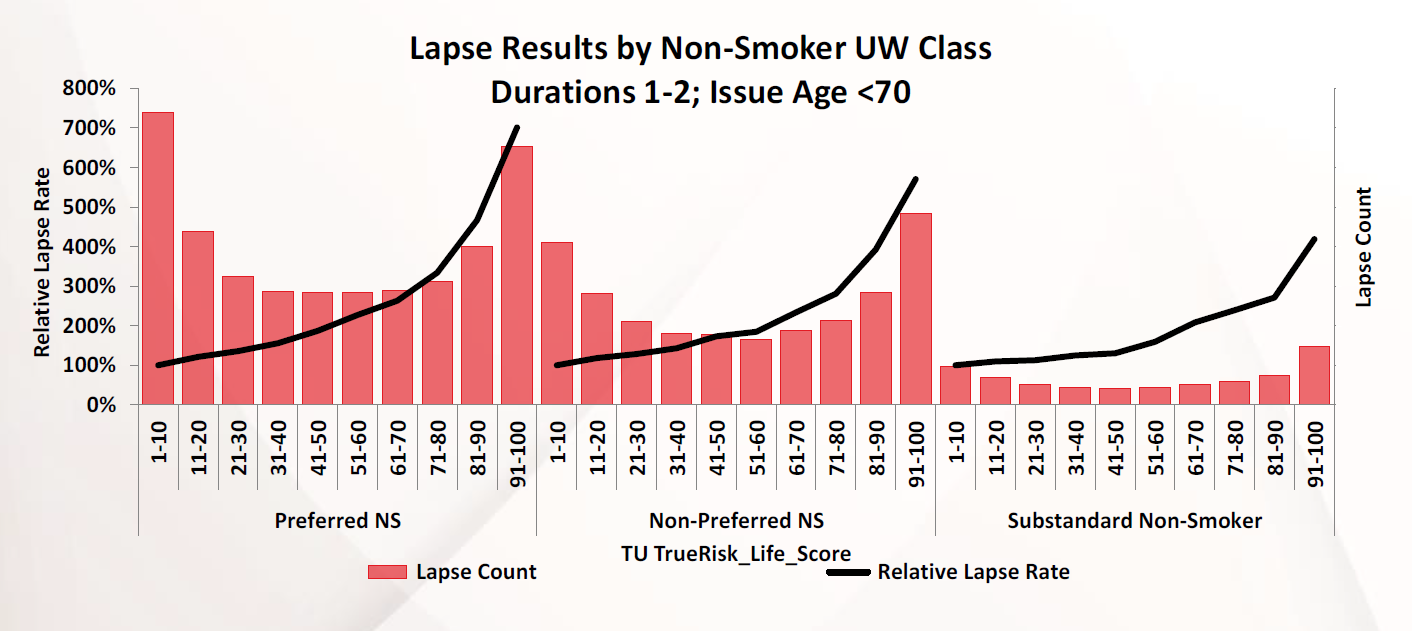
While the TrueRisk® Life model was initially created to segment mortality, relative lapse rates for those with high scores are remarkably high. Lapse outcomes were an unintended benefit of the model, which is demonstrated in Figure 6 for the fully underwritten business. Lapse rates are provided for early durations and results are shown relative to the best TrueRisk® Life scores grouping of 1-10 for each risk class.
Results are provided graphically for non-smokers but the results for smokers are similar. Lapse rates for the 91- 100 group are four to seven times higher than the 1-10 group in early durations.
Figure 6: Fully Underwritten Lapse Results by Risk Class
Non-Medical Business
This section focuses on the analysis of non-medically underwritten individual whole life plans with face amounts under $100,000. Unlike the fully underwritten business, the scores for the non-medical business are quite skewed toward higher TrueRisk® Life scores as shown in Figure 4. The 91-100 group has 22% of the exposure and 40% of the claims. Roughly 14% of exposure and 29% of claims carried scores greater than 95, and more than 10% of the claims had a score of 100. For that reason, Figure 7 shows the mortality results for the 91-100 scores split out into smaller pieces to demonstrate the additional segmentation. Although not shown here due to low claim counts, similar patterns exist with smokers.
Figure 7: Early Duration Mortality Results of the Non-Medical Business
When looking at the lapse rates of the non-medical business in Figure 8, the early duration lapse rates of those with high TrueRisk® Life scores are three-to-four times higher than those with lower scores. While not shown, similar patterns for smokers are observed.
Figure 8: Early Duration Lapse Results of the Non-Medical Business

Why Does Credit Data Work
TrueRisk® Life is very effective at segmenting mortality, even within fully underwritten preferred risk individuals, but why? Credit behavior appears to be a proxy for one aspect of personality called ‘conscientiousness,’ which is the quality of being meticulous, careful, self-disciplined, and in control of impulses.
The reason this is particularly interesting is because conscientious people tend to live longer. A high level of conscientiousness is positively associated with many biopsychosocial processes linked to mortality1 such as:
- Engaging in healthy behavior and choosing healthier environments
- Selecting and maintaining healthier friendships
- Better educational performance, more successful careers, and higher incomes
- Moderating detrimental effects of unhealthy stresses
Credit data encodes a number of conscientious behaviors making TransUnion’s TrueRisk® Life an objectively measurable proxy for conscientiousness, which is positively associated with mortality.
A 2013 study2 of approximately 6,000 U.S. adults over a 14-year observation period investigates the link between conscientiousness and mortality. Those with the lowest level of conscientiousness had around 3.2 times the mortality risk of those with the highest level. When researchers controlled for age, sex, education, marital status, and broad indicators of health-related behaviors such as smoking and alcohol use and waist circumference, the difference in risk was still around 1.6 times higher.
The U.S. population validation shown in Figure 1 suggested a six times differentiation in risk between highest and lowest risk lives. When comparing similar proportions of the insured lives validation in Figure 5, the effects of underwriting reduced the segmentation by around one-half, but there is still about a three times differentiation in risk. As the previous study just mentioned, conscientiousness has similar, albeit lower power of differentiation: about 3.2 times in the general population, which broadly halves to 1.6 times when controlling for some of the factors that would typically be taken into account in underwriting.
Understanding the predictive power of credit data and the relationship to other rating variables has been a topic of discussion in property and casualty insurance for many years. The winner of the “Best 2016 Article” award in the North American Actuarial Journal3 covers this subject and concludes “that credit scores contain significant information not already incorporated into other traditional rating variables.” The piece goes further to say “knowing risk-taking behavior in one realm (e.g., risky financial behavior and poor credit history) transits to predicting risk-taking behavior in other realms (e.g., automobile insurance incurred losses).” The authors explain the connection and similarity of so many “sensation-seeking” activities in life and go on to suggest personality differences “can predict risk-taking behavior later in life.”