In 2009, RGA and Milliman IntelliScript published groundbreaking research into how prescription drug histories impact mortality.
Since then, life insurance companies have widely adopted some version of prescription medication scoring into their underwriting.
These algorithms commonly assign each prescription in the prescription drug history a fill score, which is based on the severity of the condition the medication was prescribed to treat. A higher score indicates the medication treated a more severe condition, while lower scores suggest treatments for more benign conditions. The prescription history’s overall score represents the most severe medication(s).
This research is the first to examine the mortality experience of those with only low-severity medications in their prescription histories, with a particular focus on those individuals with few fills.
Severity Scores and Data
RGA’s Rx Underwriting Severity Score product has been in use in the life insurance industry for more than 10 years. RGA’s medical doctors and under- writers continuously review all of the prescription medications available in the US and use the system’s rules to produce a severity score for each. Scores range from 1 to 10, with 1 for medications associated with low-risk conditions and 10 for medications associated with very high-risk conditions.
Low-severity medications are defined in this report as those with severity scores of 1 through 3. These medications are either mostly preventive or treatments for mild conditions. Examples include: prescription vitamins (severity score 1), medications for acne and rosacea (severity score 1), medications for allergies or glaucoma (severity score 2), and medications that treat hyperlipidemia or hypothyroidism (severity score 3).
If a person’s history contains multiple prescription medications, the one with the highest score is used as that person’s overall severity score. This score is referred to as the “max score.” Persons with low max scores would typically be expected to have low mortality risk.
RGA has a well-established database containing prescription medication histories and death information for millions of individuals. For this analysis, RGA focused on individuals ages 20-79 at the time of scoring. We set an evaluation date that split the time period assessed into two sectors: the first, consisting of prescription histories for the 6 years up to the evaluation date; and the second, the mortality experience of the group for the 5 years following the evaluation date. Altogether, the group covered 109 million person- years of exposure and more than 530,000 deaths. The expected mortality basis used the empirical (actual) mortality experience of the dataset, varying by gender, attained age and calendar year.
Mortality by Max Score
Past research determined people with Rx benefit coverage but no Rx histories (classified as “eligibility only”) tended to have higher mortality risk than those who have Rx histories.1 The research detailed in this article is the first to determine those with only low-severity medications in their histories may not necessarily be the best risks.
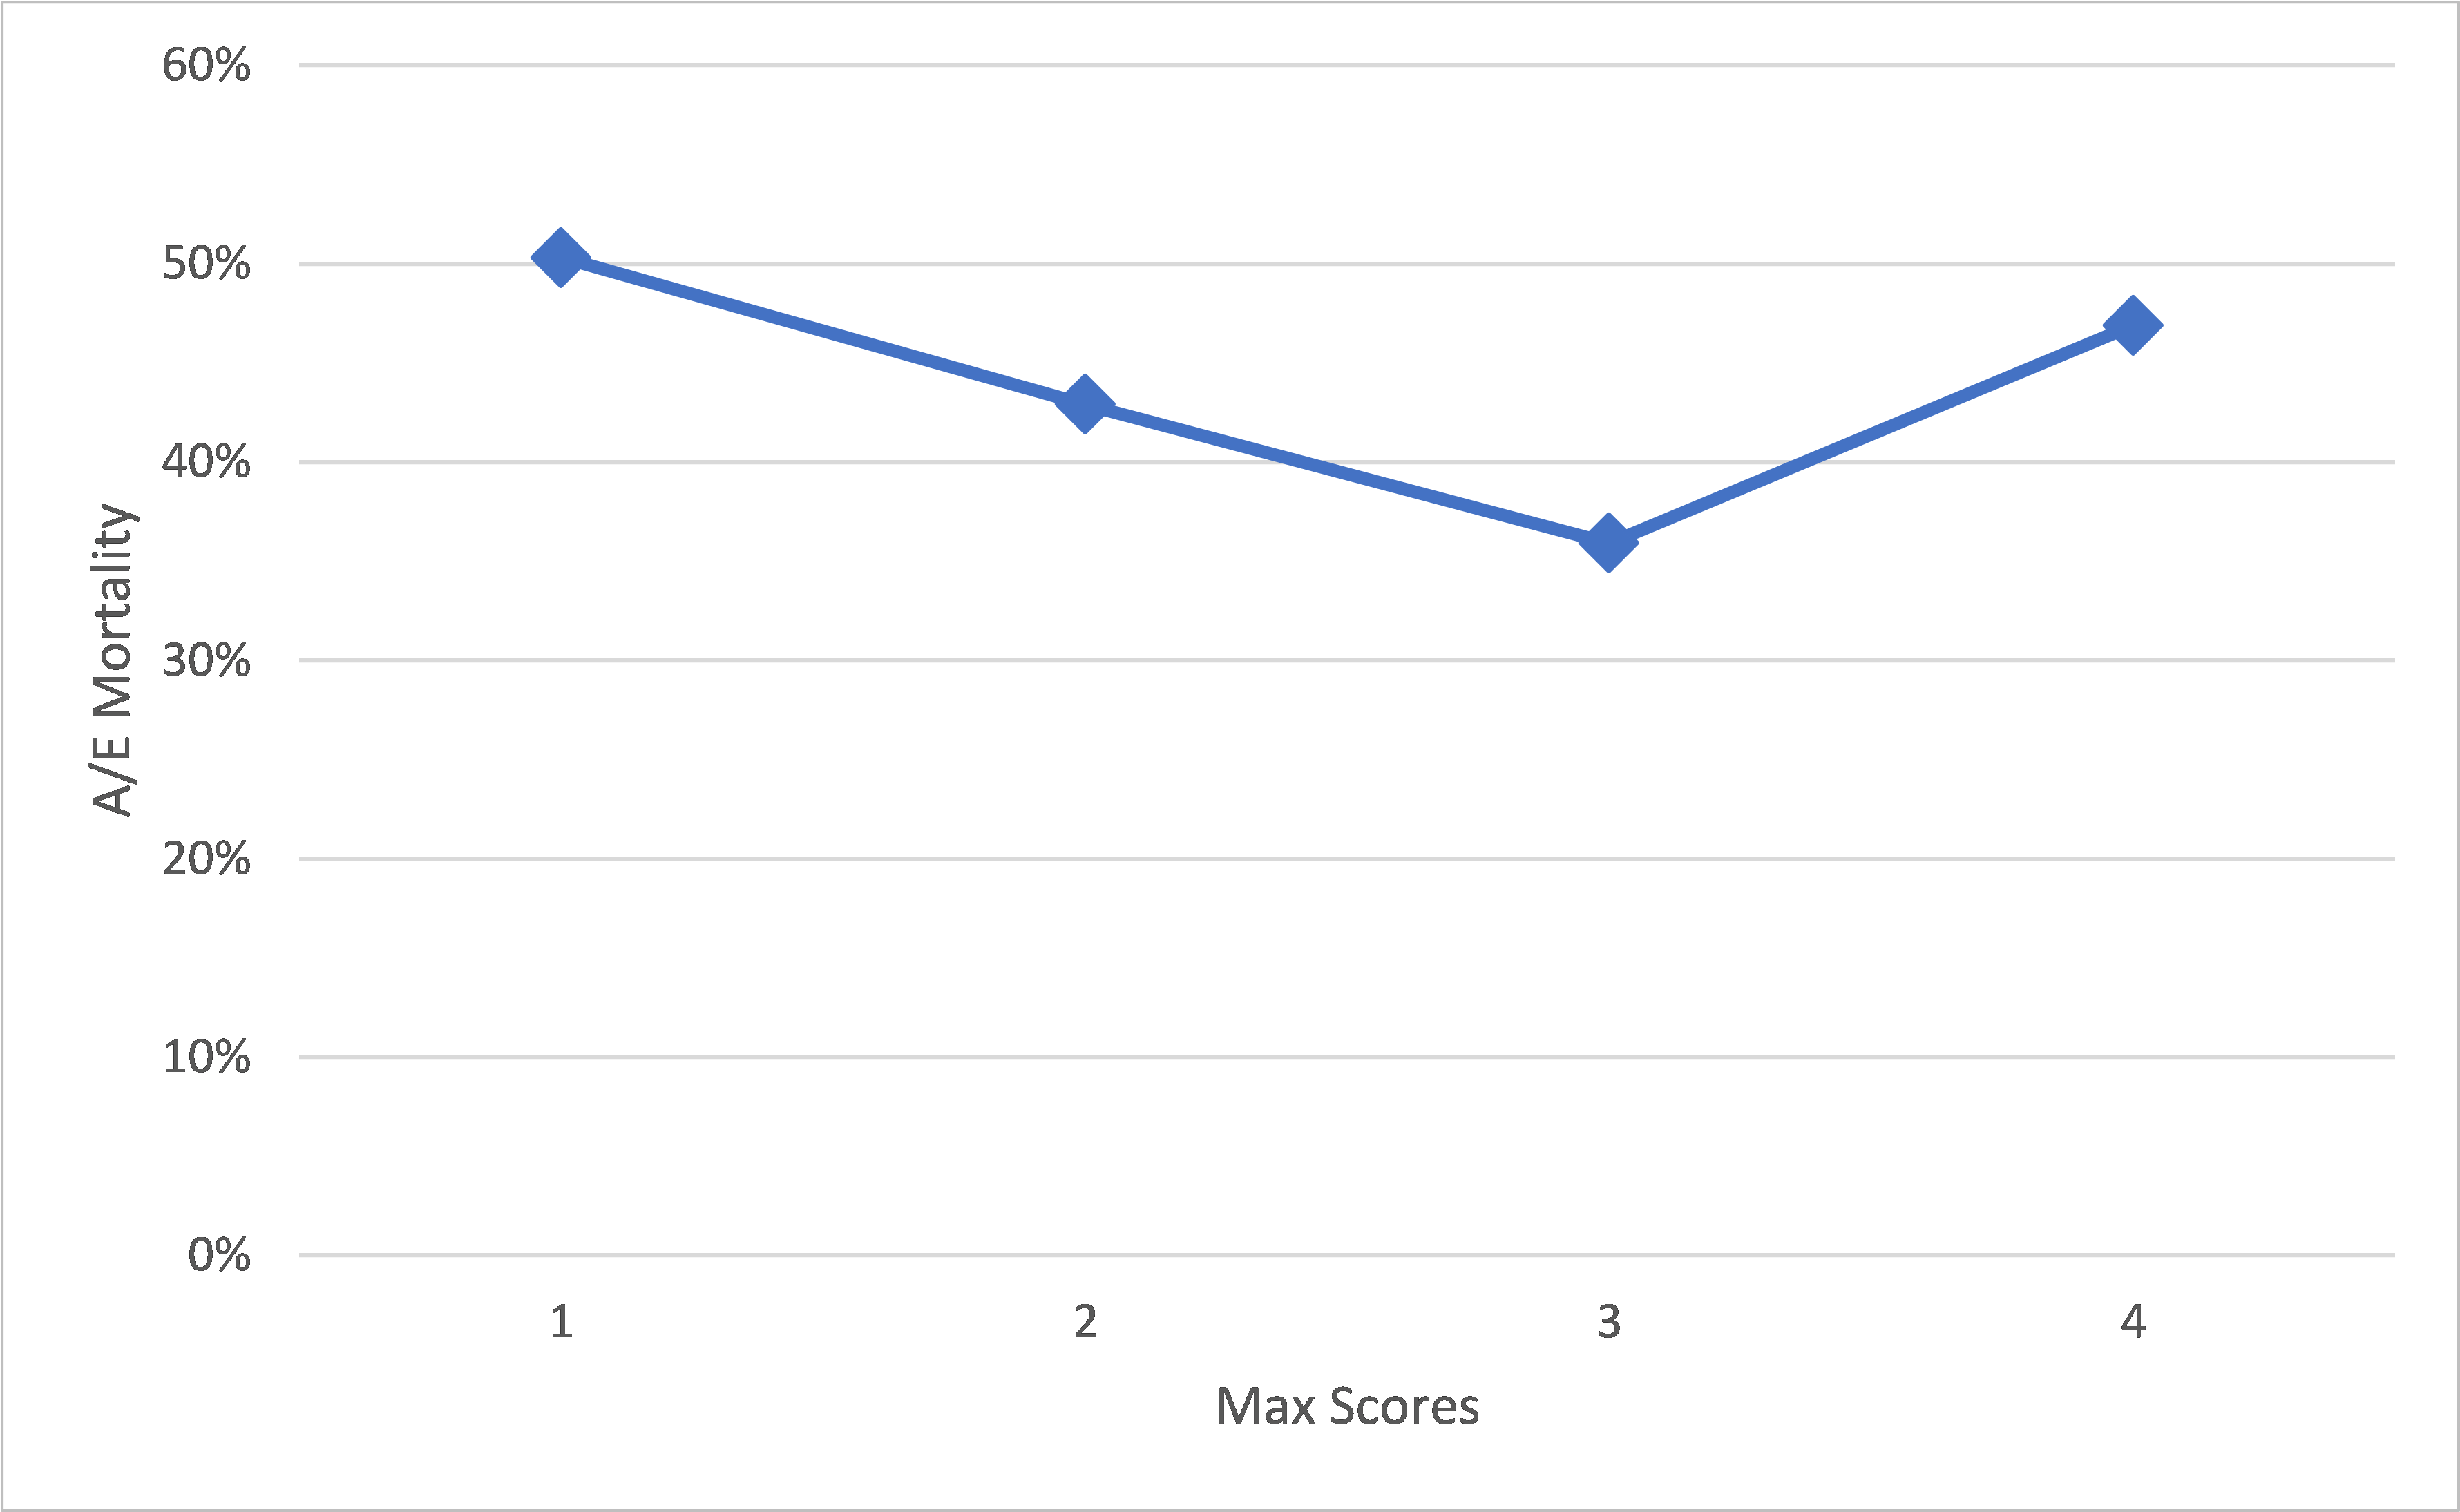
Figure 1 shows the actual-to-expected mortality curve (A/E) for the dataset and the distribution of exposures by max score. Overall, the scores are highly predictive of mortality, with those having max scores of 10 found to exhibit more than seven times the mortality of those having max scores of 1. However, the solid mortality line does not monotonically increase through the lowest scores. When zooming in on the subset of max scores 1 through 4 (Figure 1a), one can see that individuals with the very lowest max scores (1 and 2) experienced higher mortality than those with max scores of 3.
Figure 1. A/E and Exposure Distribution by Max Scores
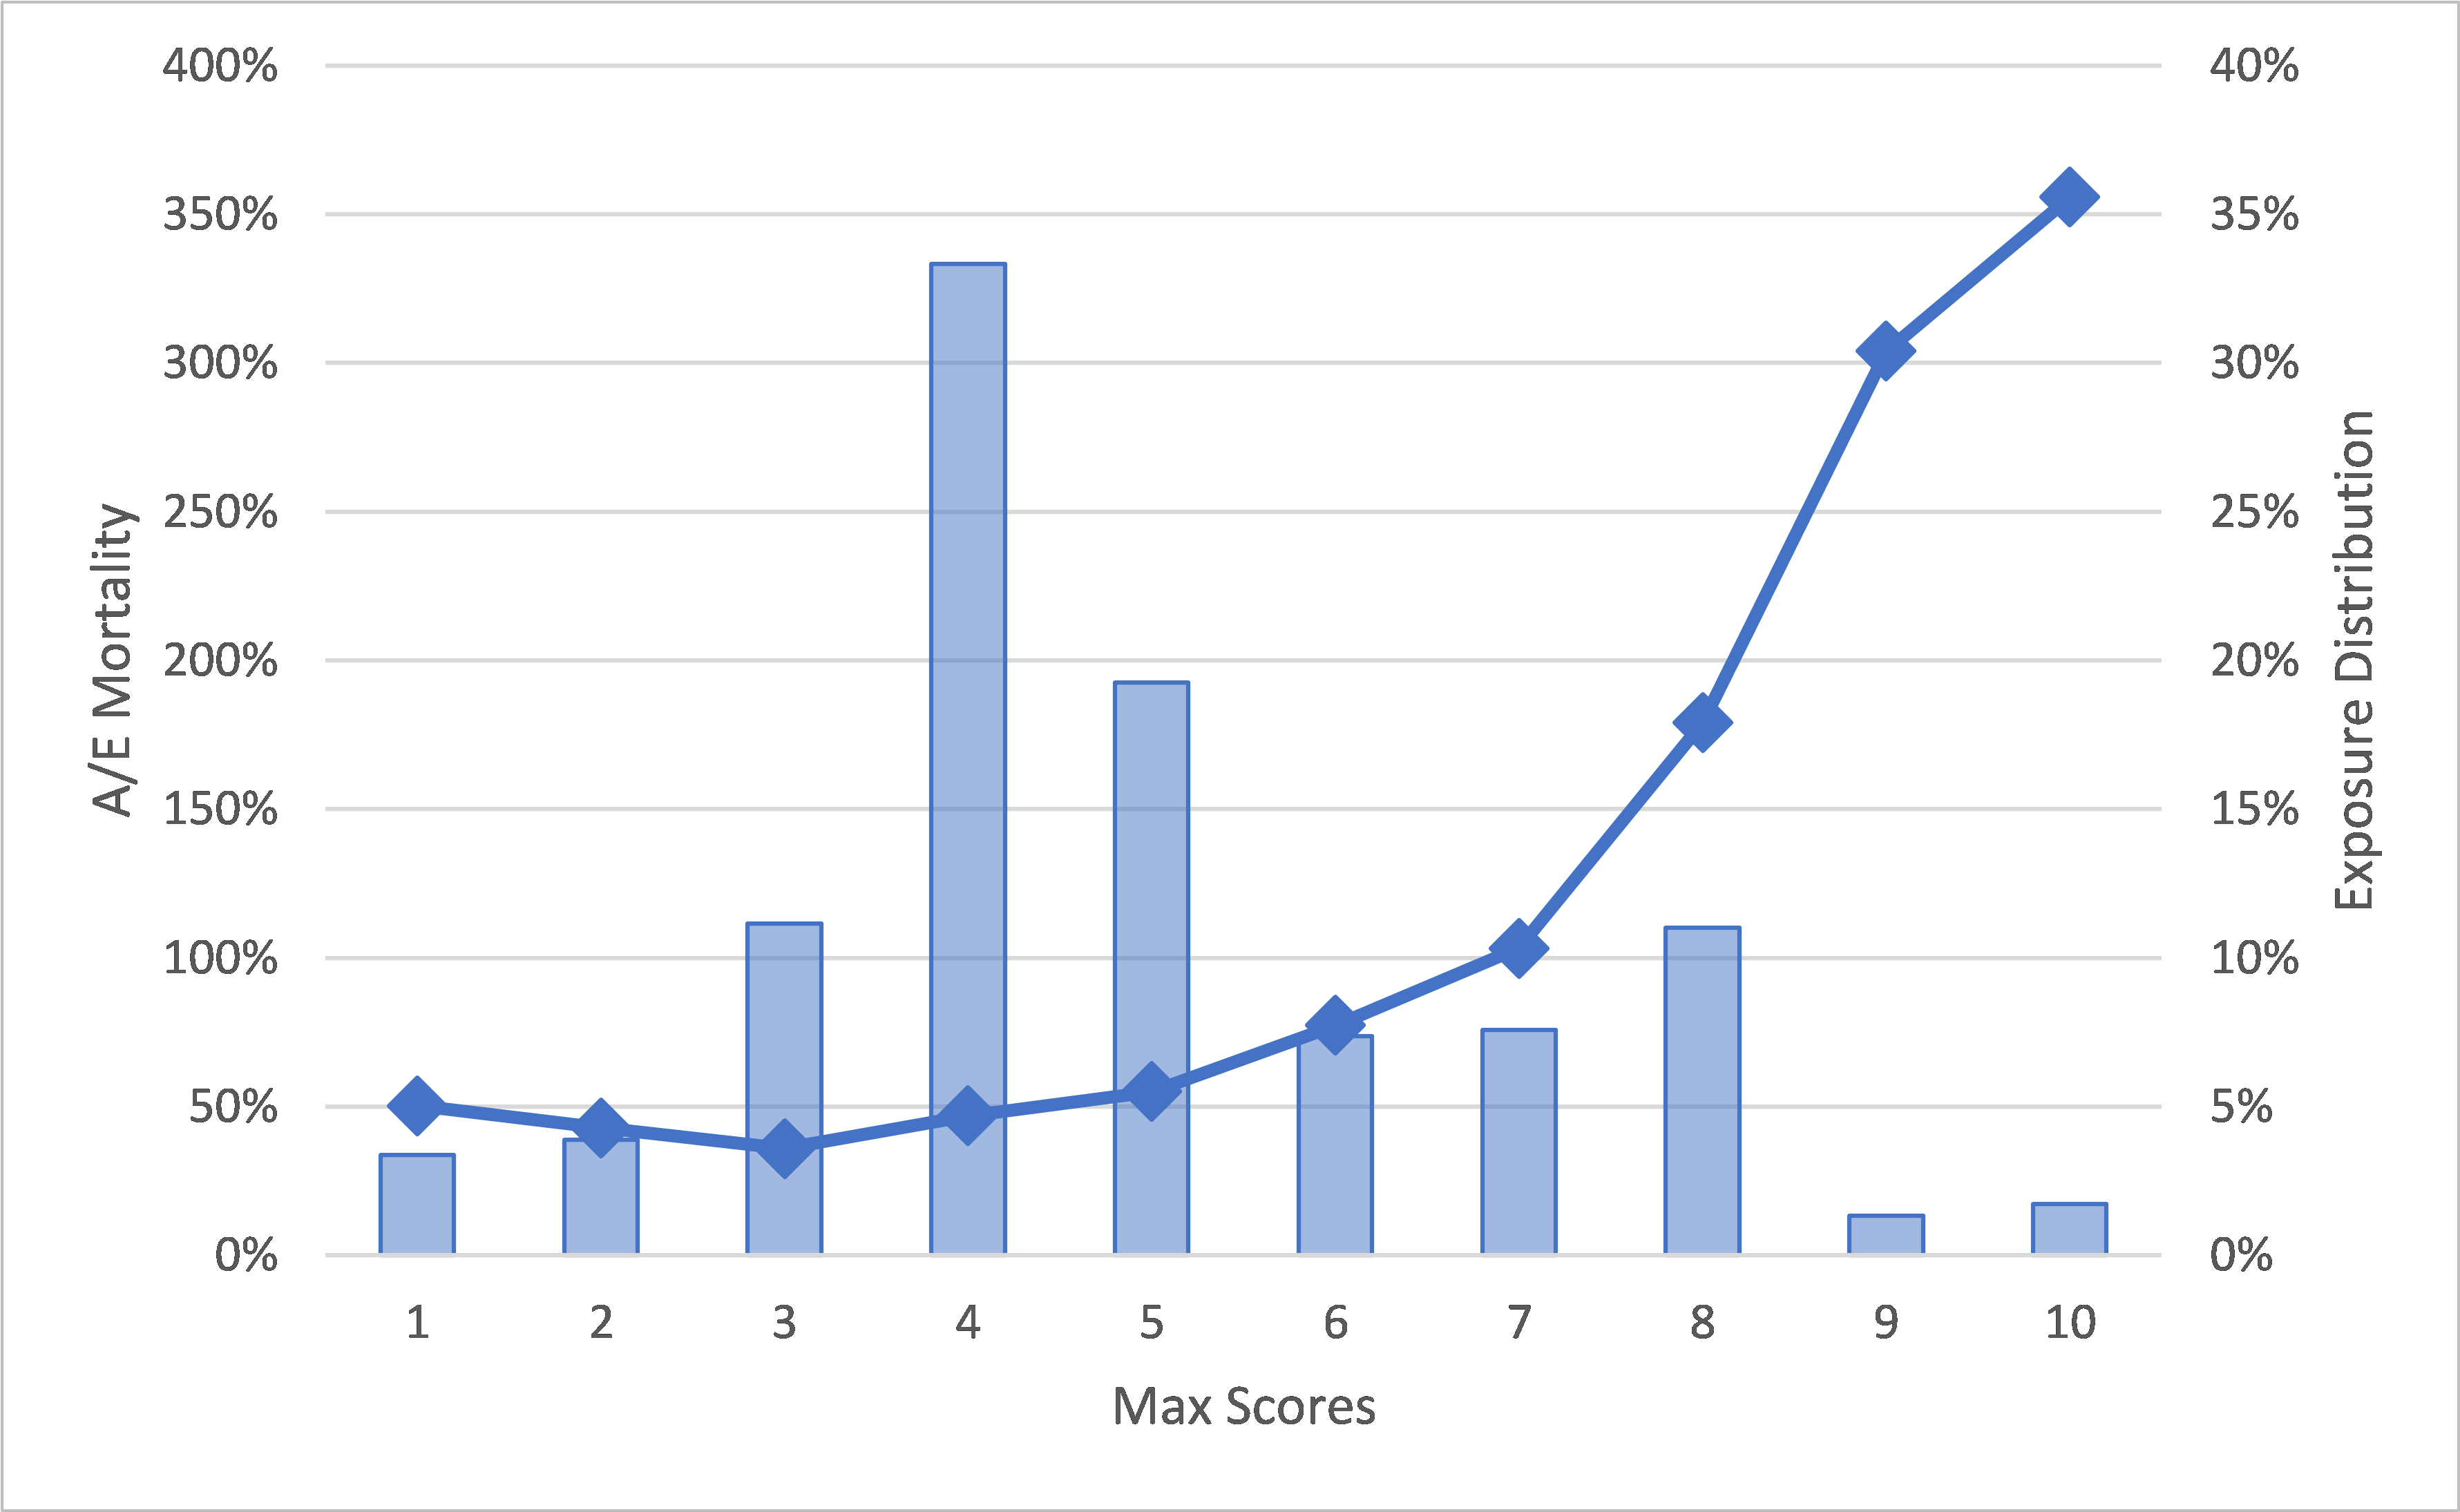
Figure 1a. A/E for Max Scores 1-4
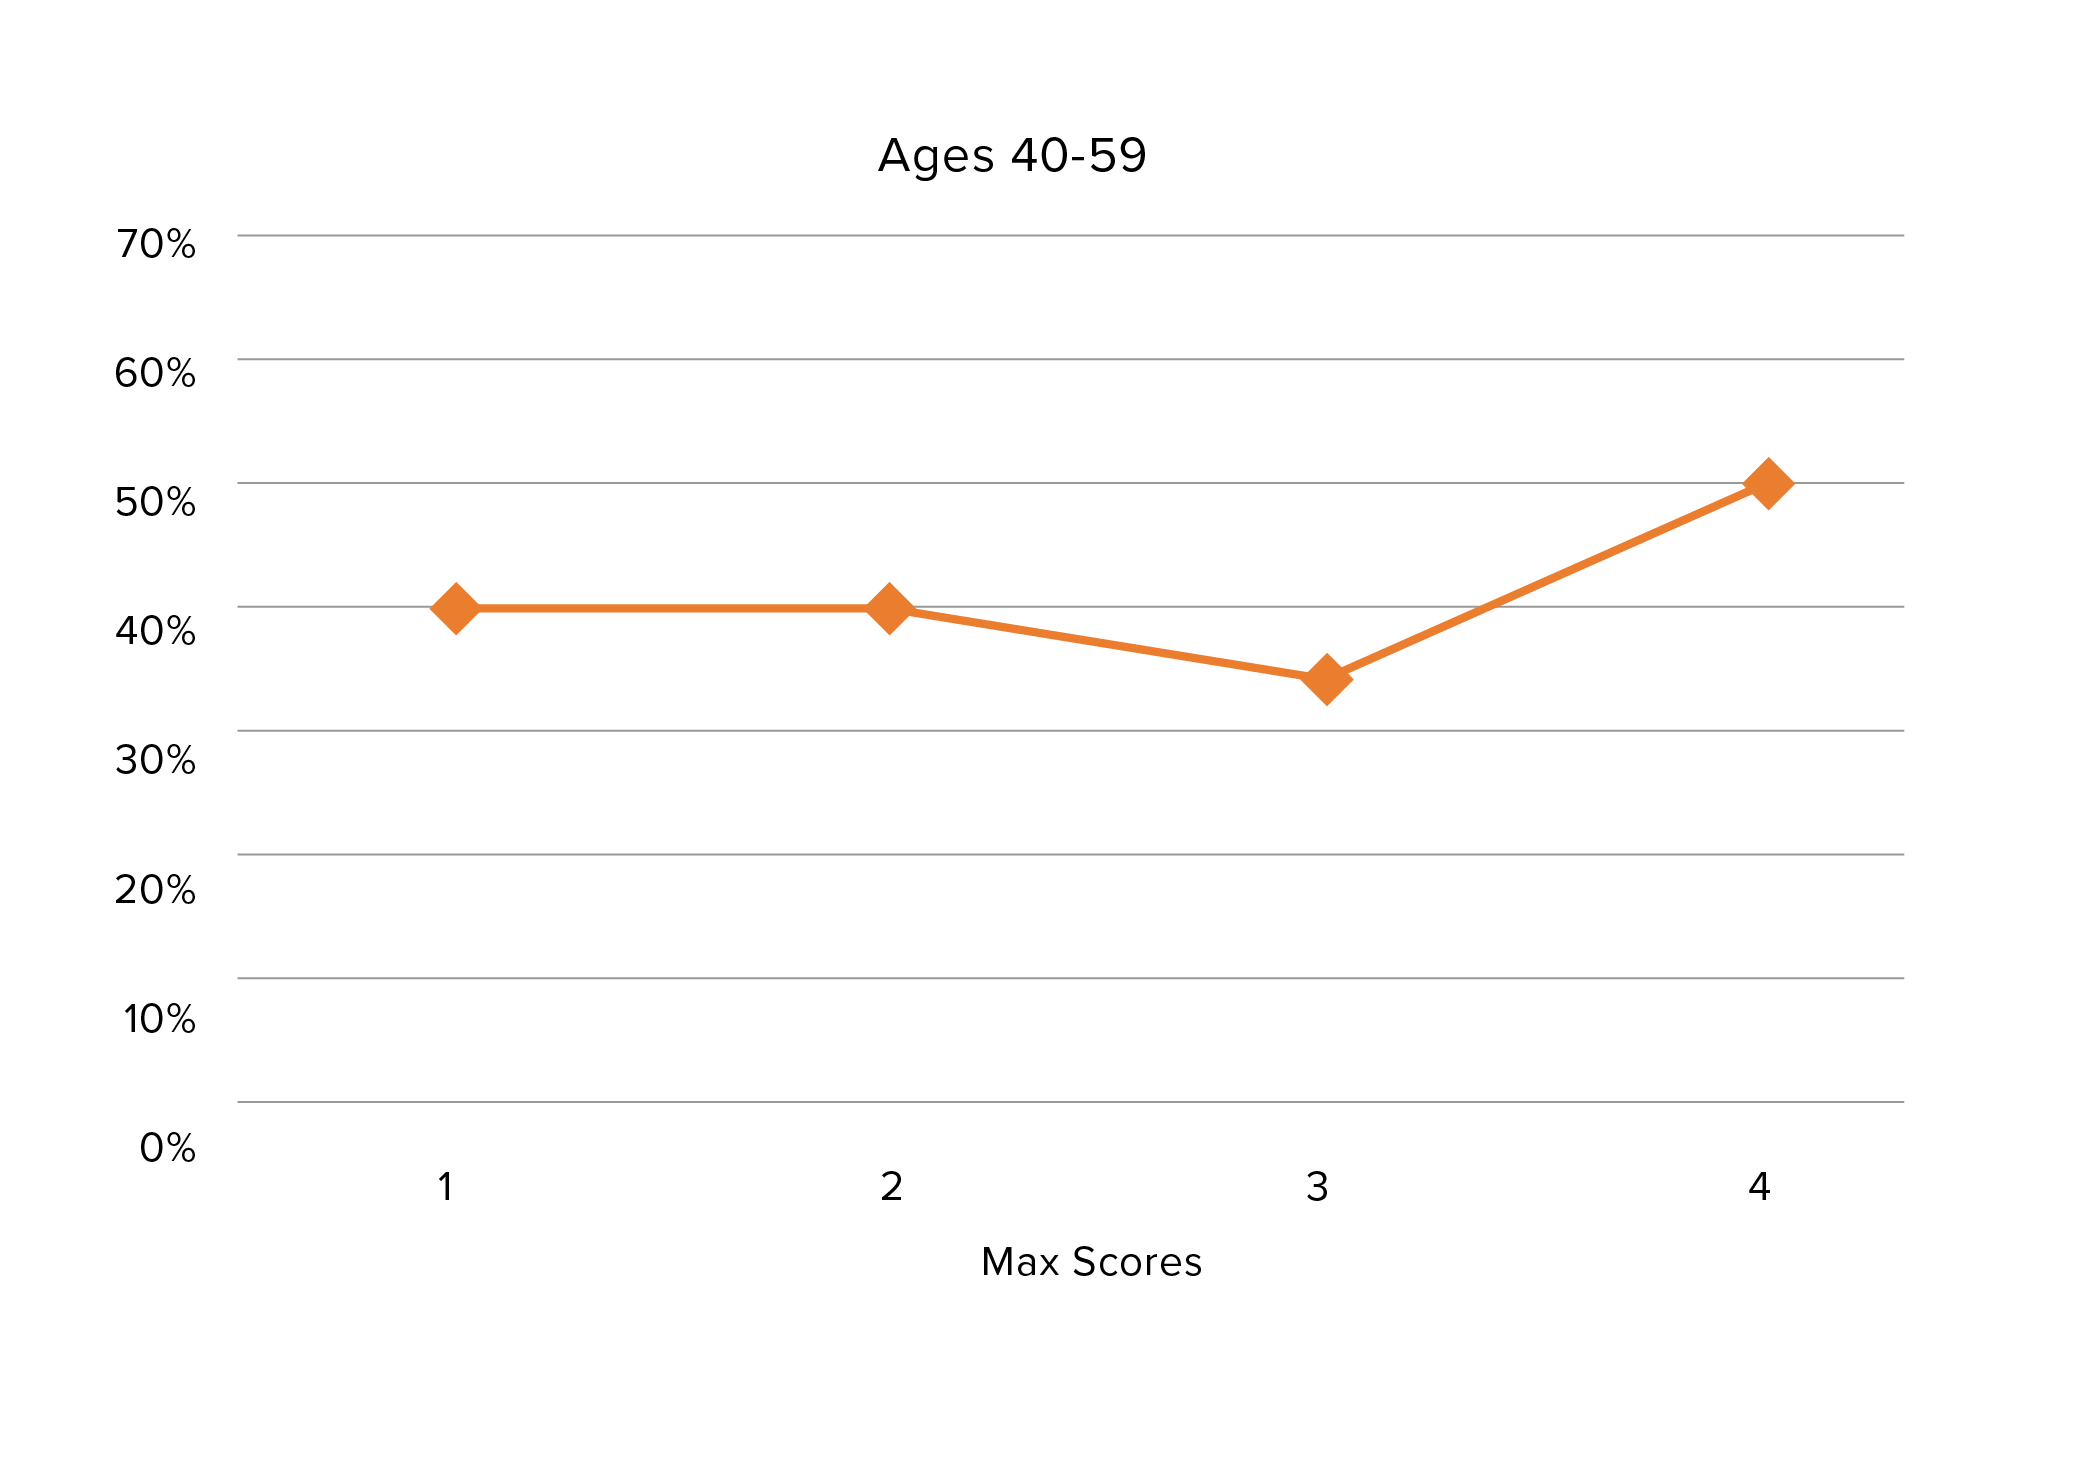
Age is an important variable in the analysis. Overall, max scores 1, 2 and 3 represent about 18% of the dataset’s mortality exposure. Among younger-age individuals (20 to 39), however, the proportion of those with low max scores is higher (29%). Inversely, in the oldest age band (60-79), a lower proportion (9%) have low max scores. The three graphs in Figure 2 display the mortality patterns for max scores 1-4 for three age bands.
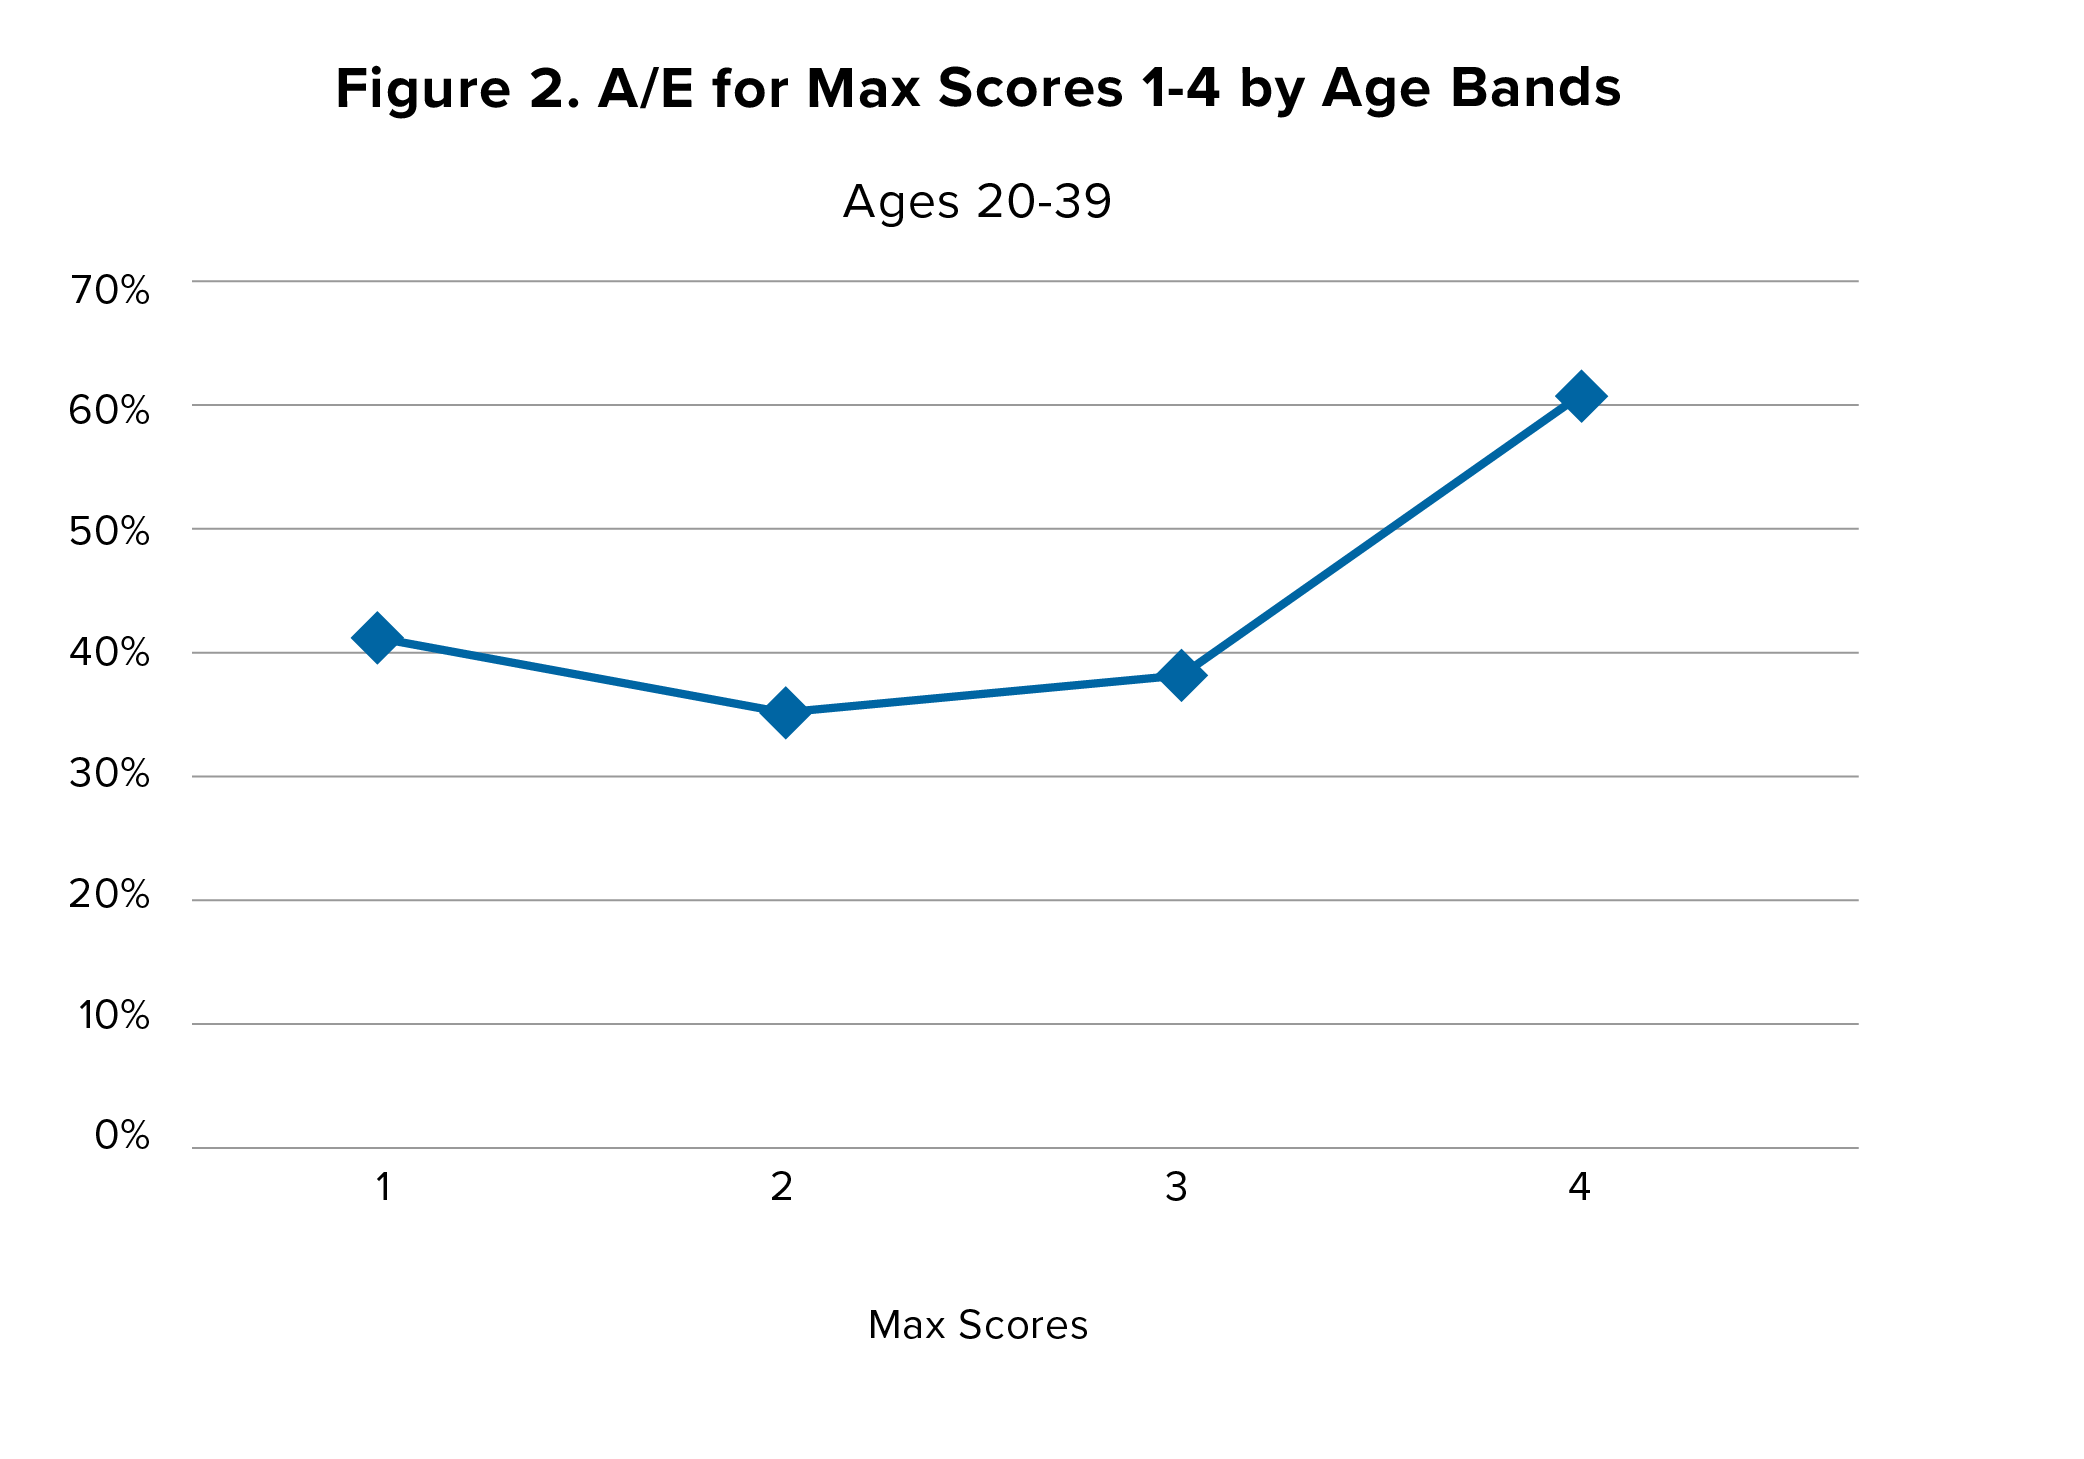
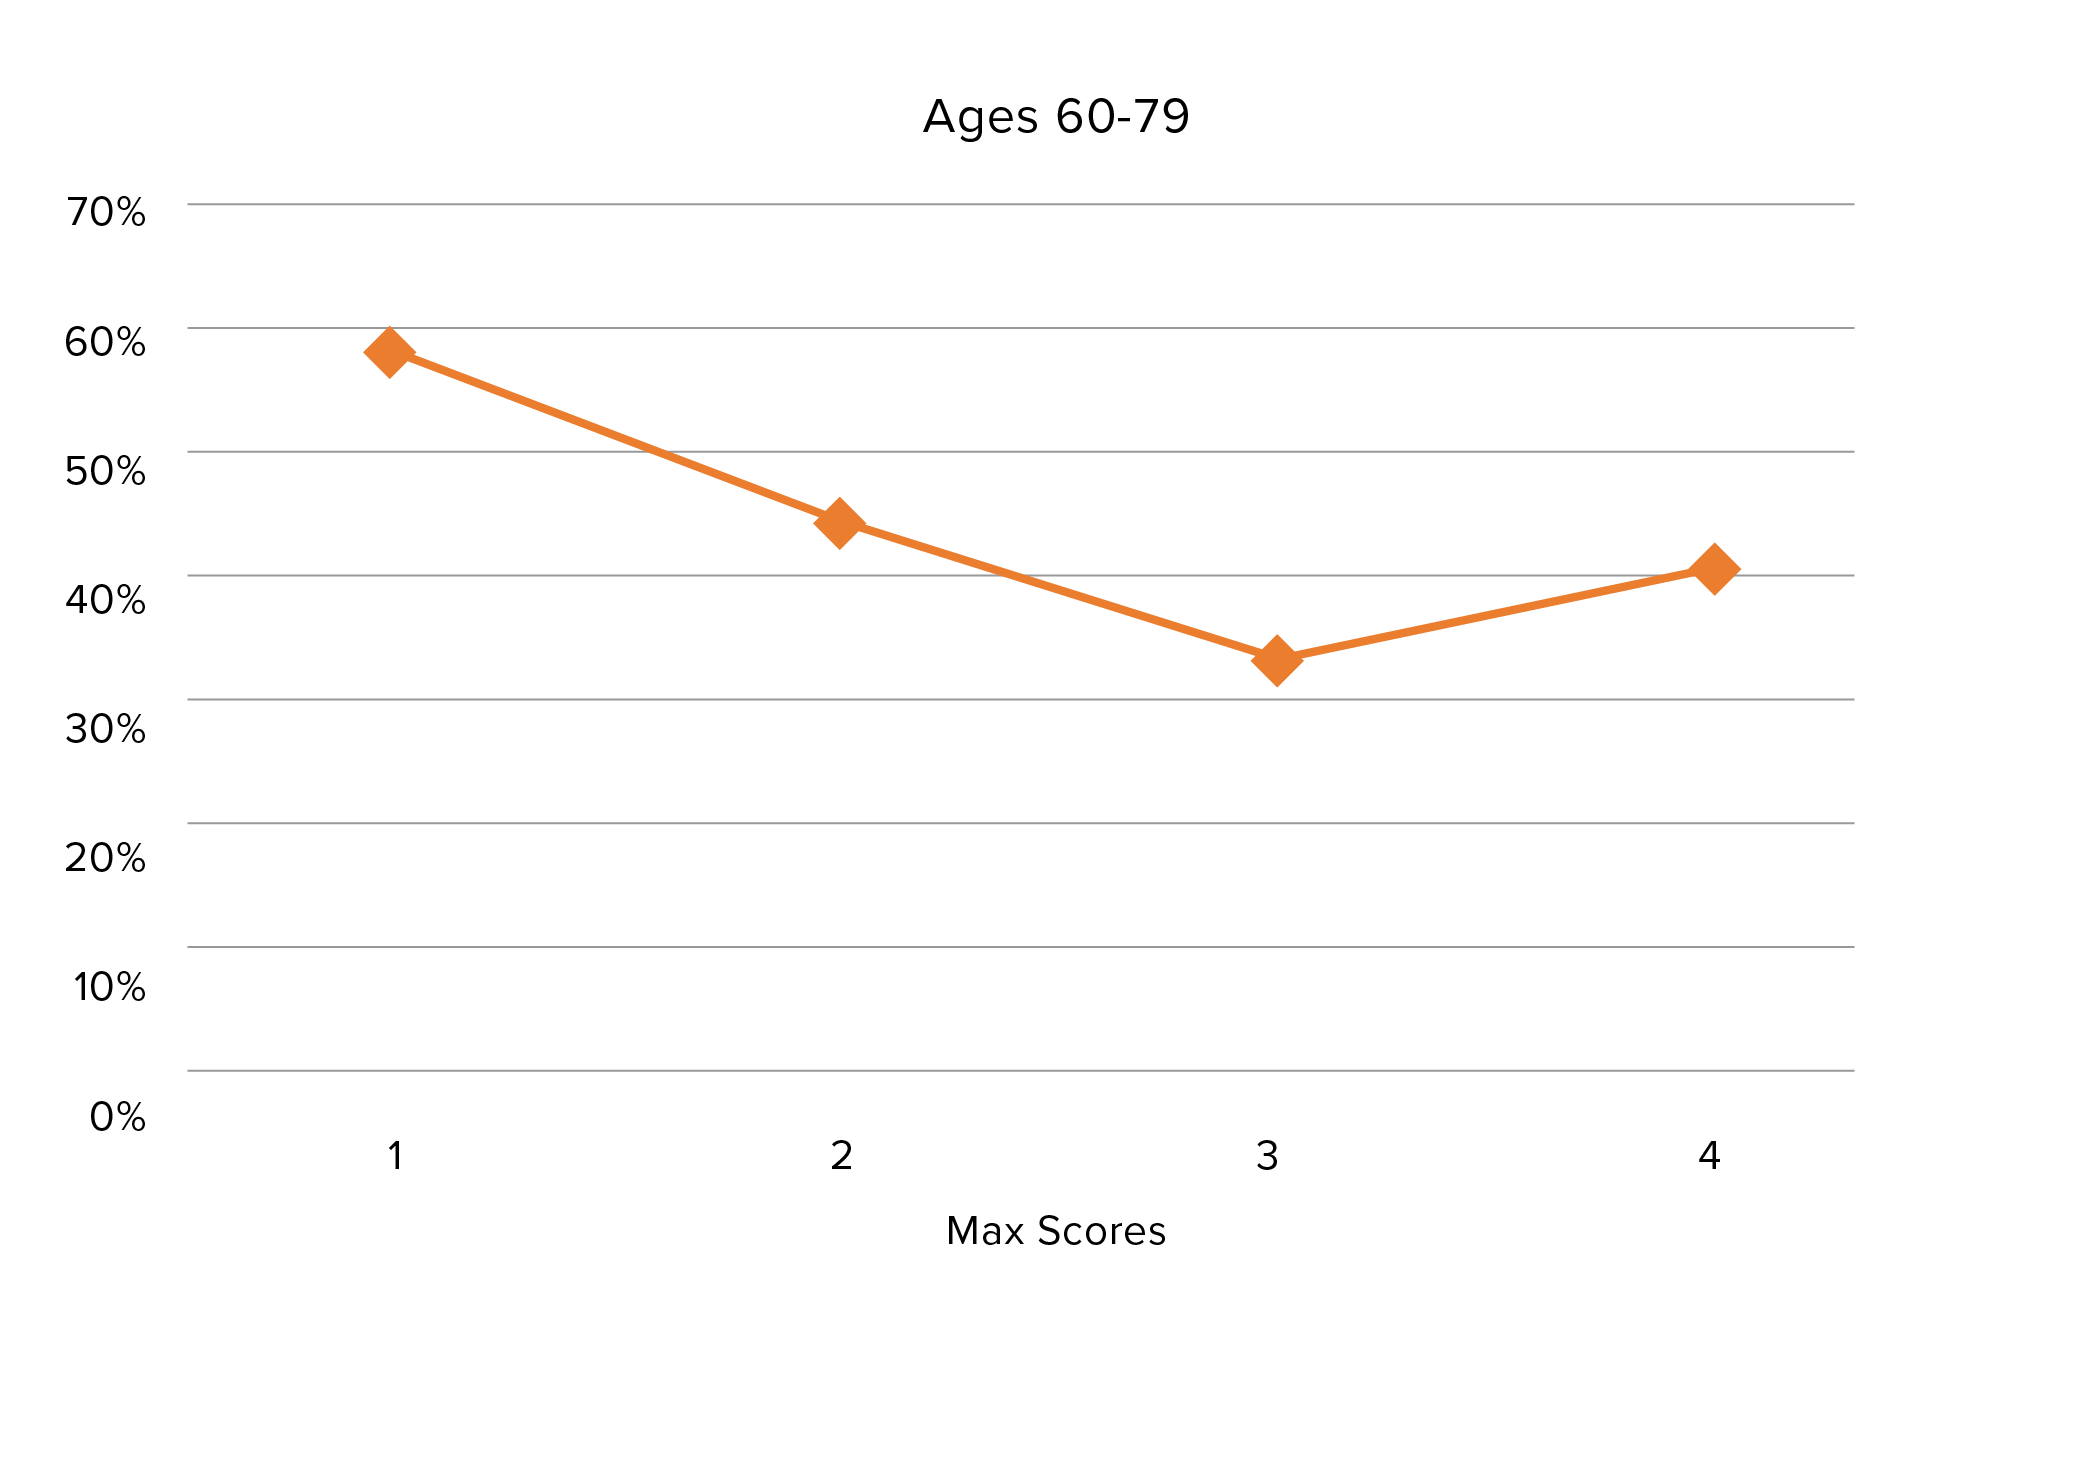
Within each age band, those with max scores of 1 were found to always have higher mortality than those with max scores of 2.
In the youngest age band (20-39), the mortality of those with max scores of 2 is lowest. However, this pattern changes for older age bands. The most pronounced difference is seen in the age 60 to 79 age band, where the mortality of those with max scores of 1 and 2 is noticeably higher than those with max scores of 3 and 4. In other words, for the oldest age band, when the only medications in their histories are those with very low severity scores, mortality is higher than for peers who have max scores of 3 or 4. Those with max scores of 1 and 2 still exhibit relatively low mortality, but they may not be the very best risks in their age cohort. Since the medications all have low scores and are being prescribed primarily for low-risk and benign conditions, what could be driving the higher mortality?
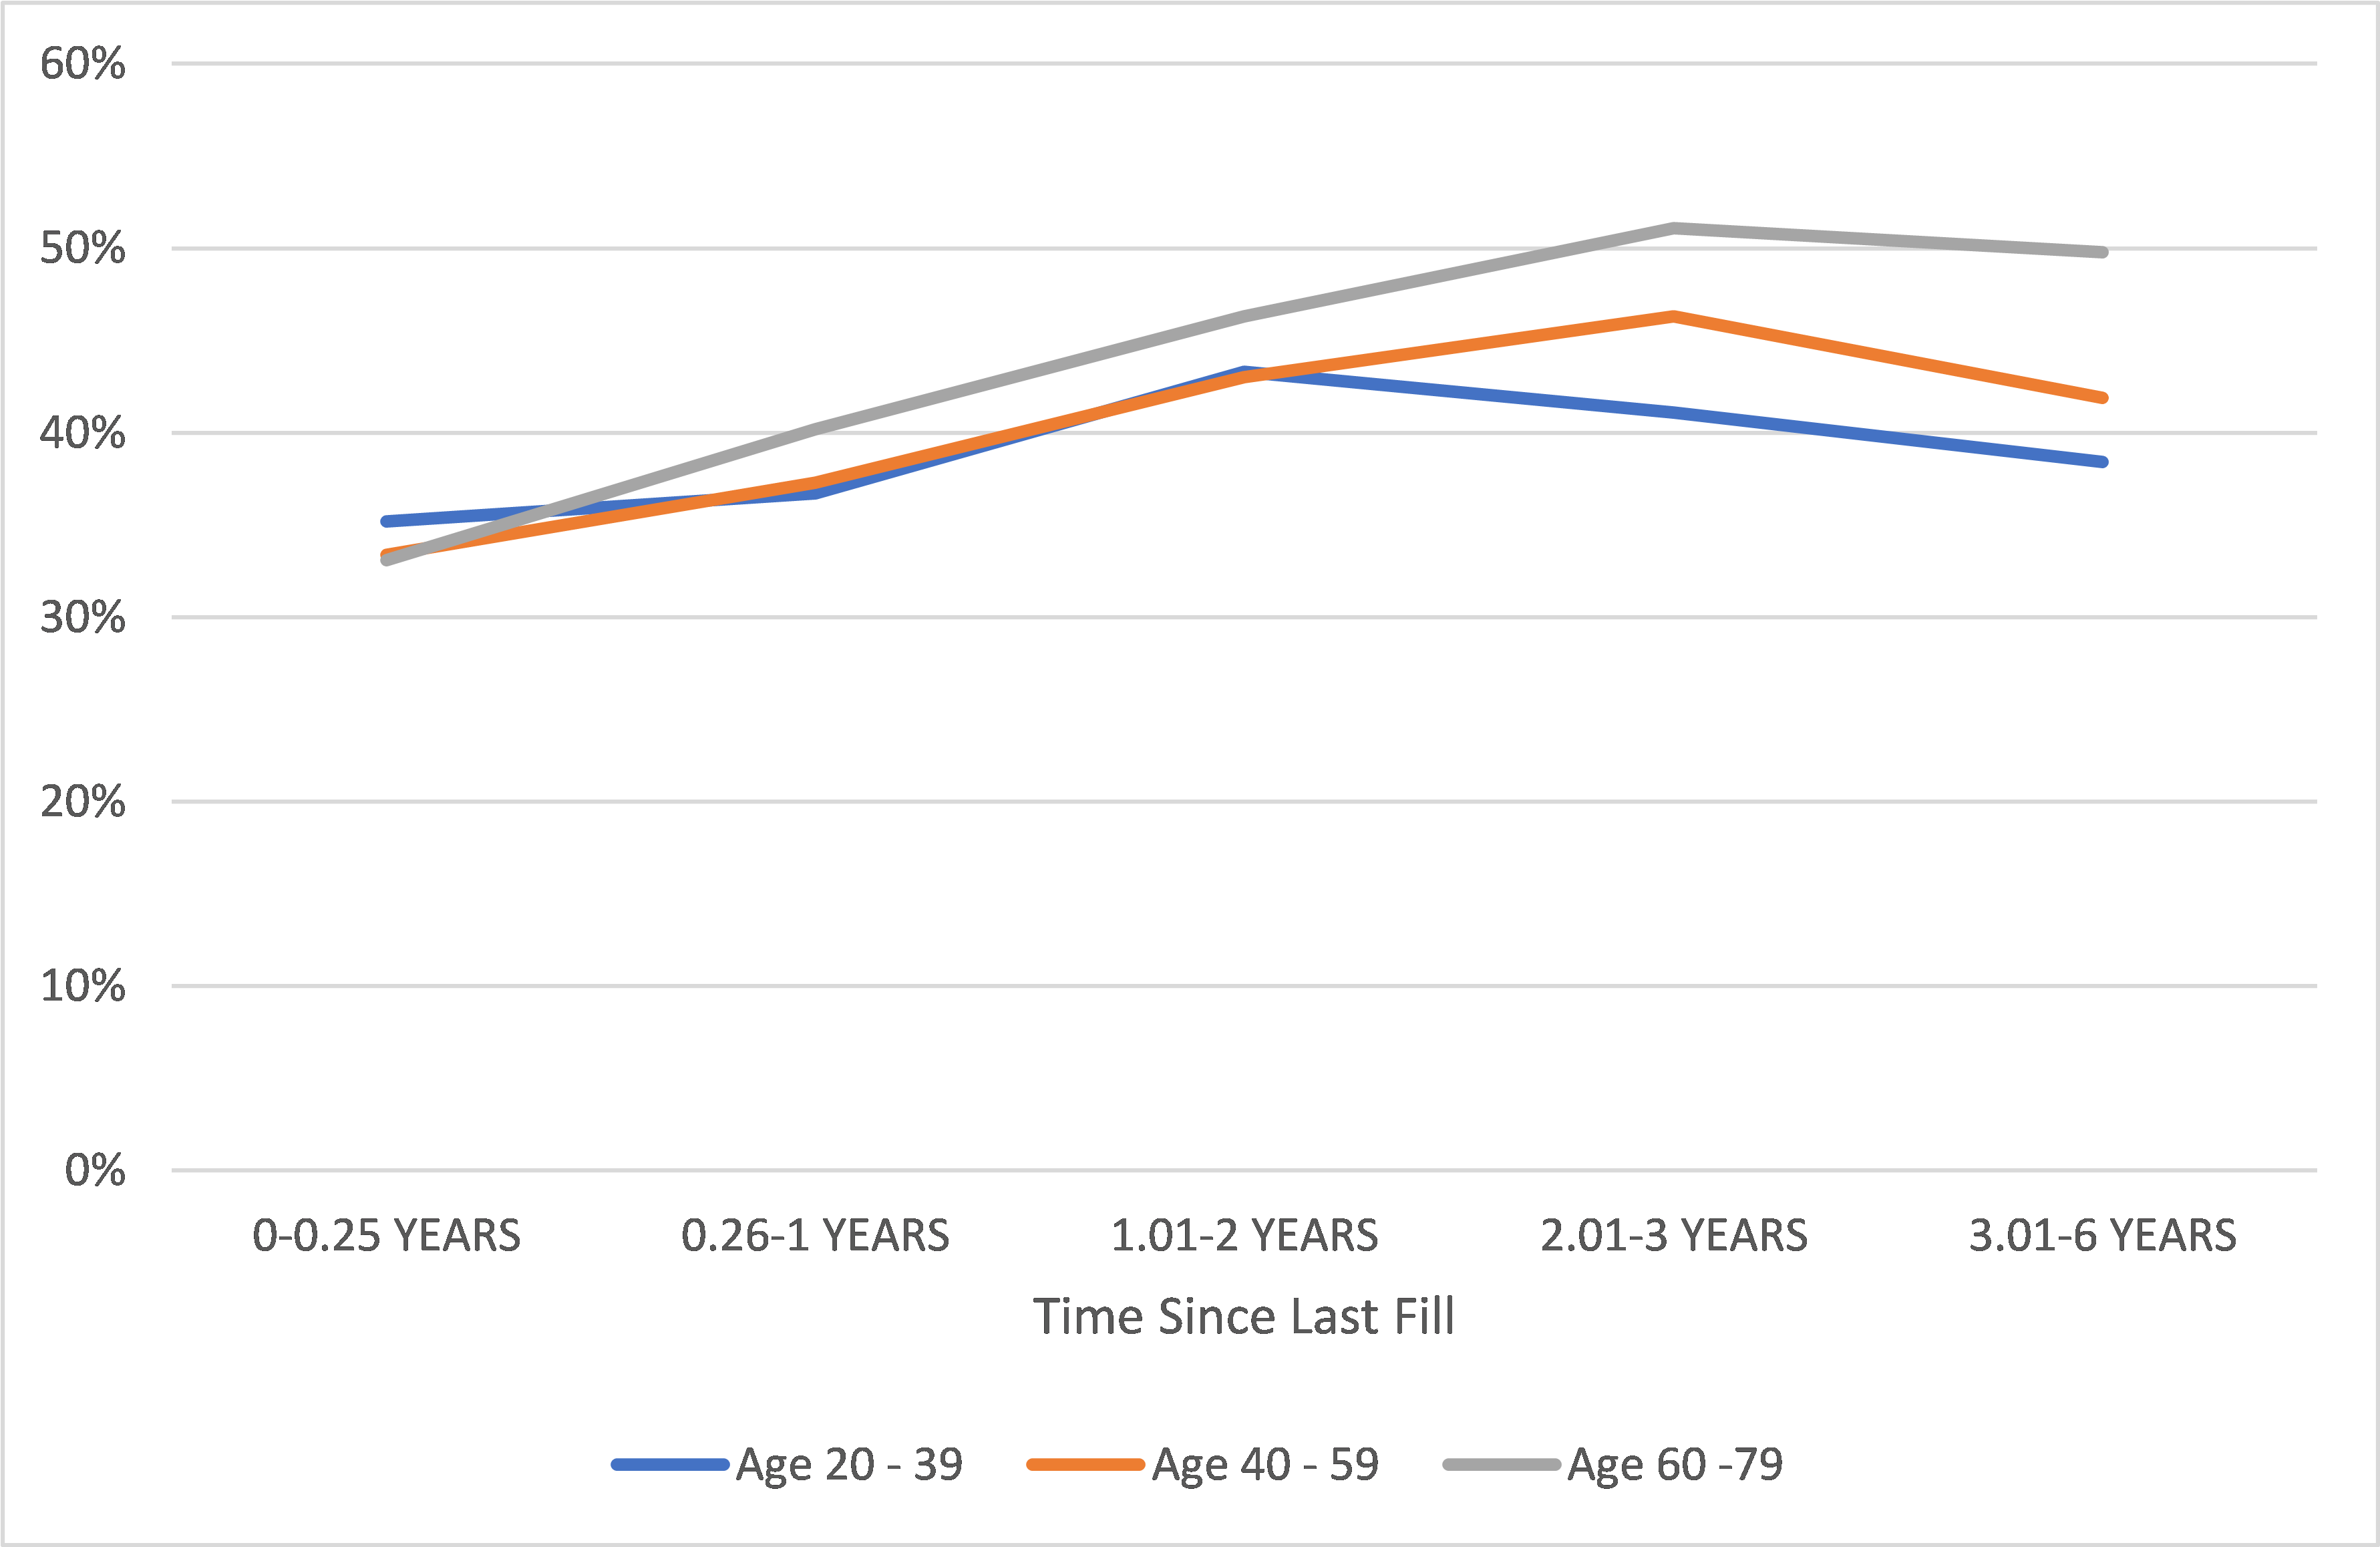
Figure 3. A/E by Time Since Most Recent Fill and Age (Max Scores 1-3)
One hypothesis is that the cohort with only low-severity medications in their histories might include individuals who do not receive consistent medical care. Indeed, those individuals with only low-severity medications in their histories correlate with those who have the fewest fills (“thin histories”) and/or fewer recent fills (less current Rx information or “recency”). Their mortality would, therefore, be higher than that of those who have the same max scores but visit doctors regularly and are prescribed medications to treat and prevent medical conditions. A lack of regular medical care would be of greater concern for older-age individuals.
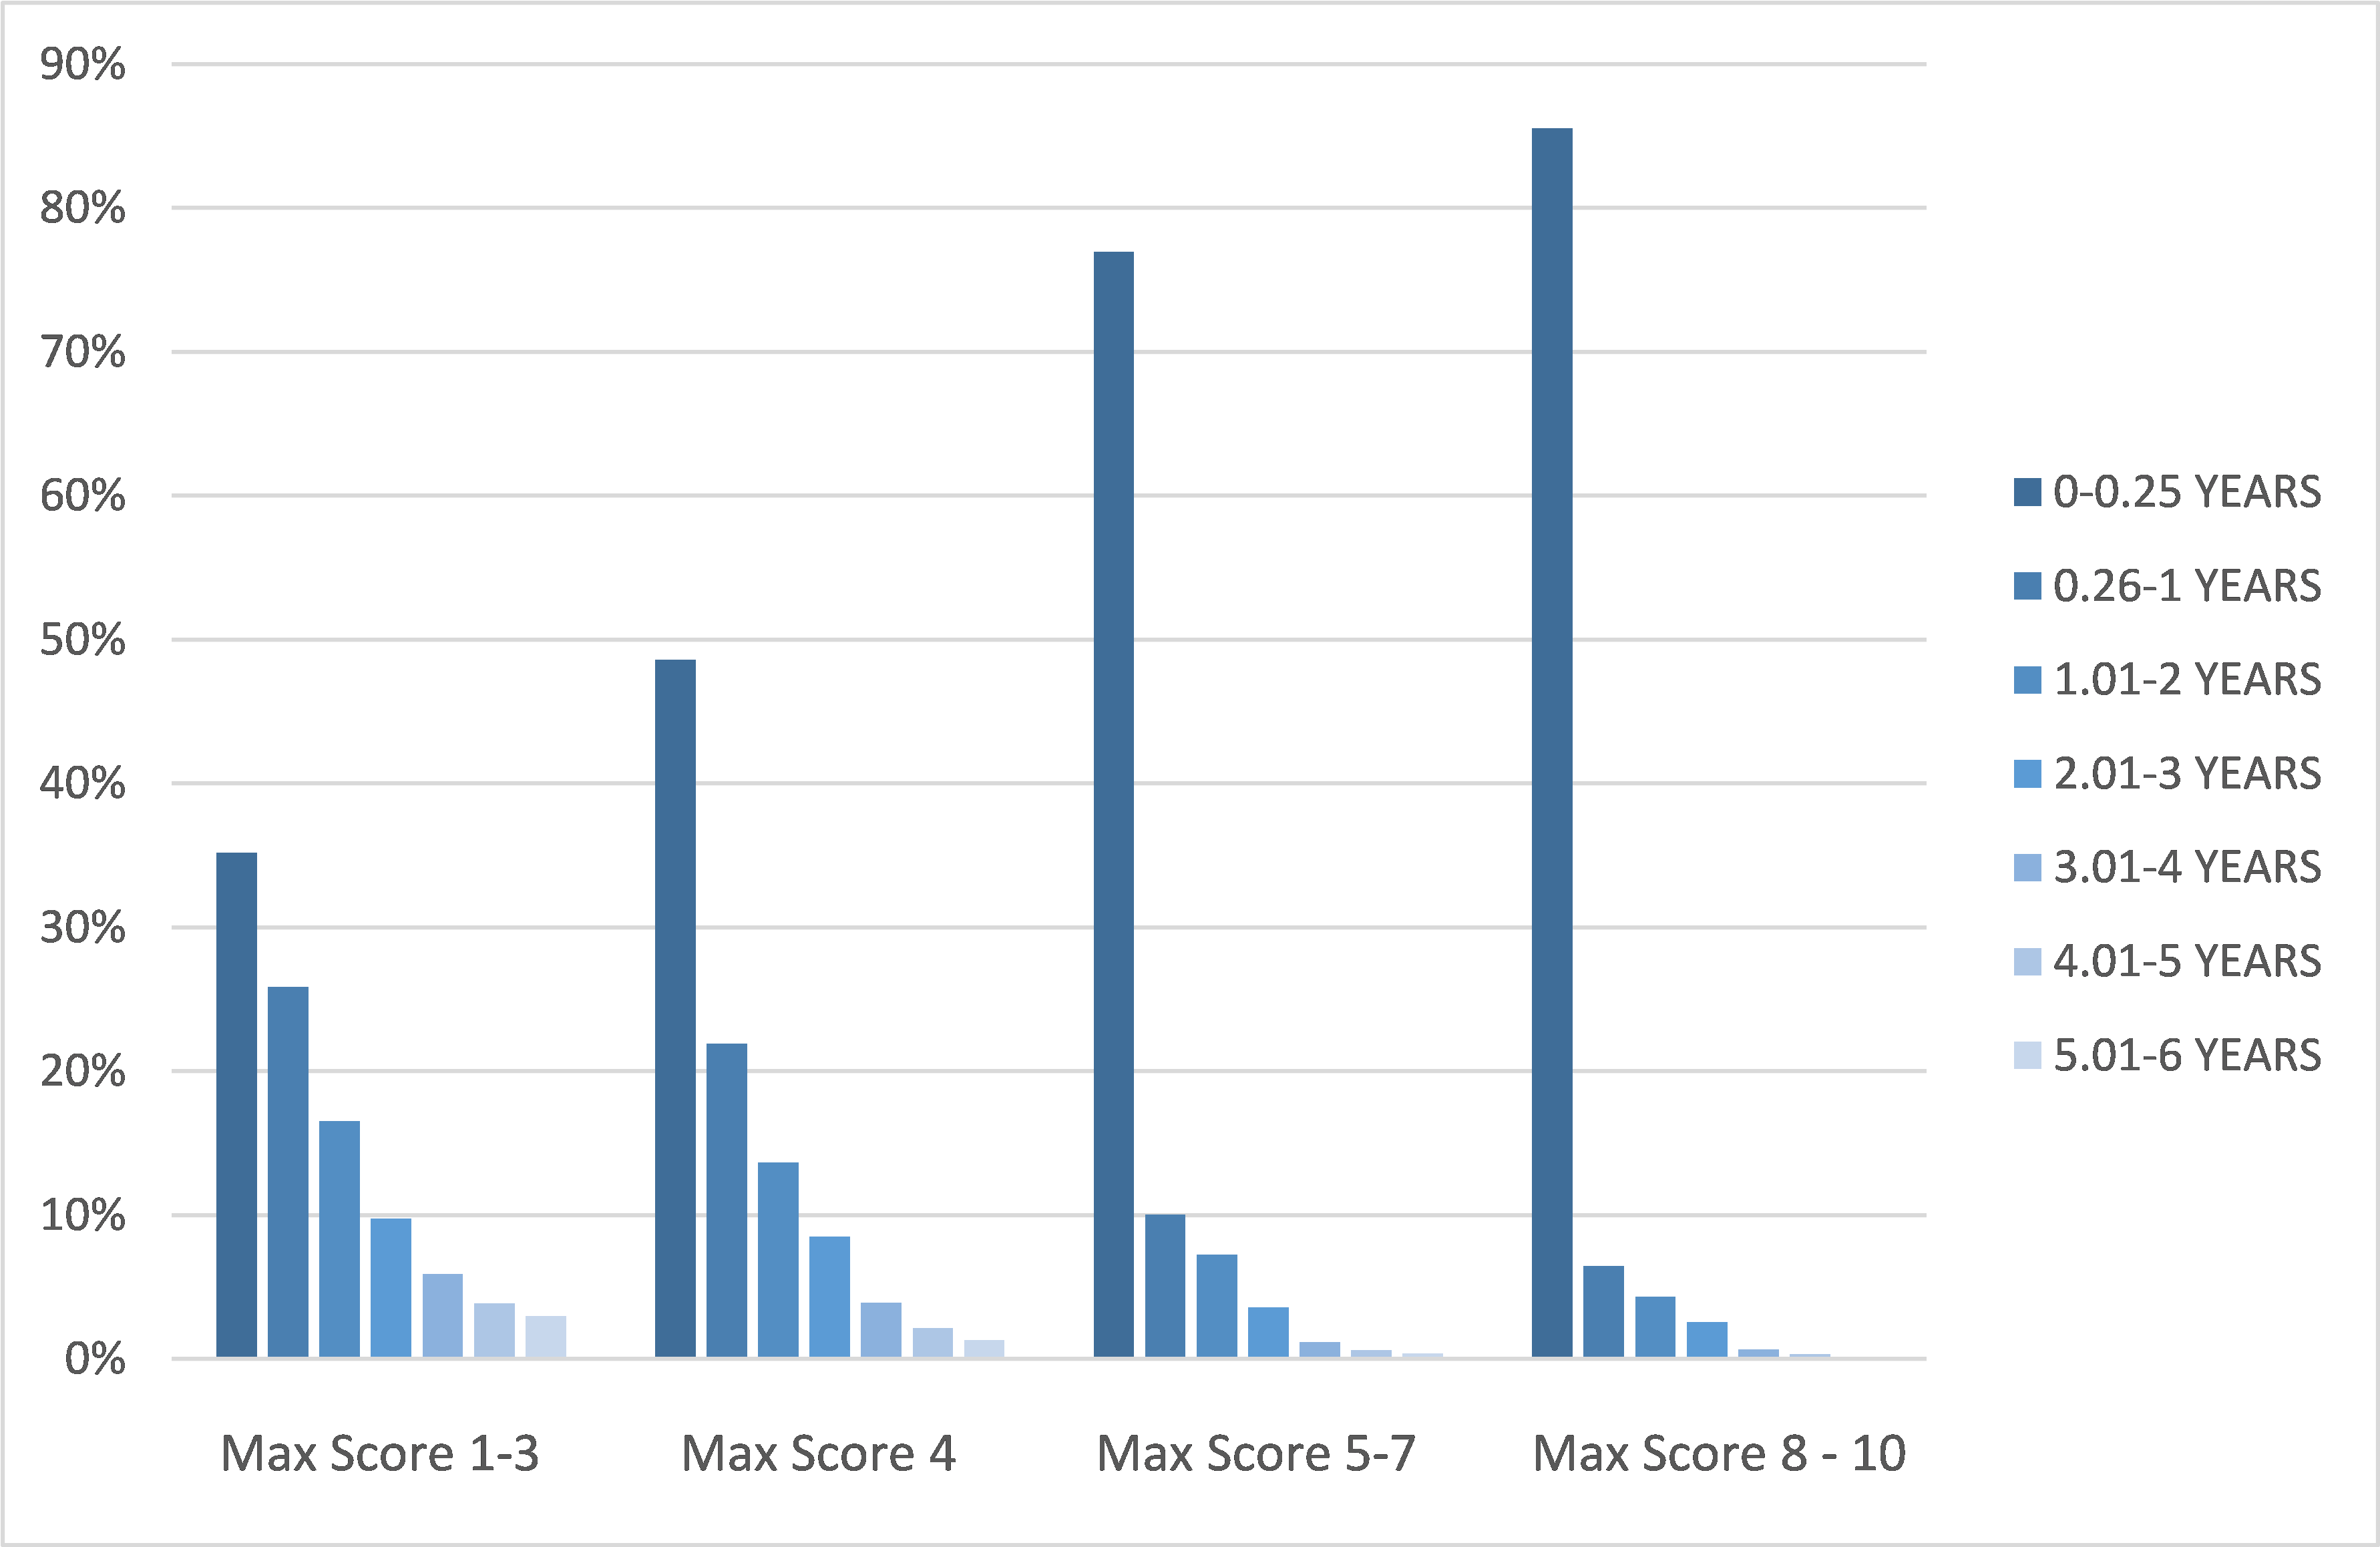
Figure 4. Exposure Distribution by Time Since Most Recent Fill and Max Score Group
As a measure of recency, we explored this hypothesis by using the time between the most recent fills and the evaluation date in each dataset member’s prescription history. For the frequency metric, we measured overall number of fills. These two attributes served as a proxy for the robustness of each prescription history.
Recency
Figure 3 provides a view into the mortality pattern of those with low max scores (1-3) for three age bands, using the time since their most recent fills.
For those with low max scores, the more time elapsed between the most recent medication prescribed prior to the evaluation date and the evaluation date itself, the more likely it was for that person to have experienced higher mortality than those who have the same max scores but had been prescribed medications closer to the evaluation date. Better mortality experience for those with more recent prescription information is seen across all age bands, but with a steeper increasing pattern in older age bands. This result appears to support the lack of care hypothesis.
It is important to keep in mind that recency and max score metrics correlate. Figure 4 shows the exposure distribution by max score groups and time since the most recent fill. Those with lower scores are less likely to have recent fills.
Frequency
Figure 5 continues to focus on those with low max scores, assessing the mortality patterns for this group by frequency (overall fill counts) for three age bands.
As the chart shows, individuals with low max scores and fewer prescriptions in their histories experienced higher mortality than peers with more prescriptions. The better mortality experience for those with more fills in their prescription histories is observed across all age bands, with a steeper slope at older ages. This observation also supports the lack of care hypothesis. Note members of the youngest age band (20-39) are more likely to have fewer fills than older ages.
Frequency and max scores also correlate. Figure 6 shows exposure by max score groups and fill counts. Those with lower max scores tend to have fewer fills than those with higher scores.
Recency and frequency in an Rx his- tory do correlate, as expected. Those with fewer fills are more likely not to have recent fills, and those with more fills are more likely to have recent fills.
Figure 5. A/E by Fill Count and Age (Max Score 1-3)
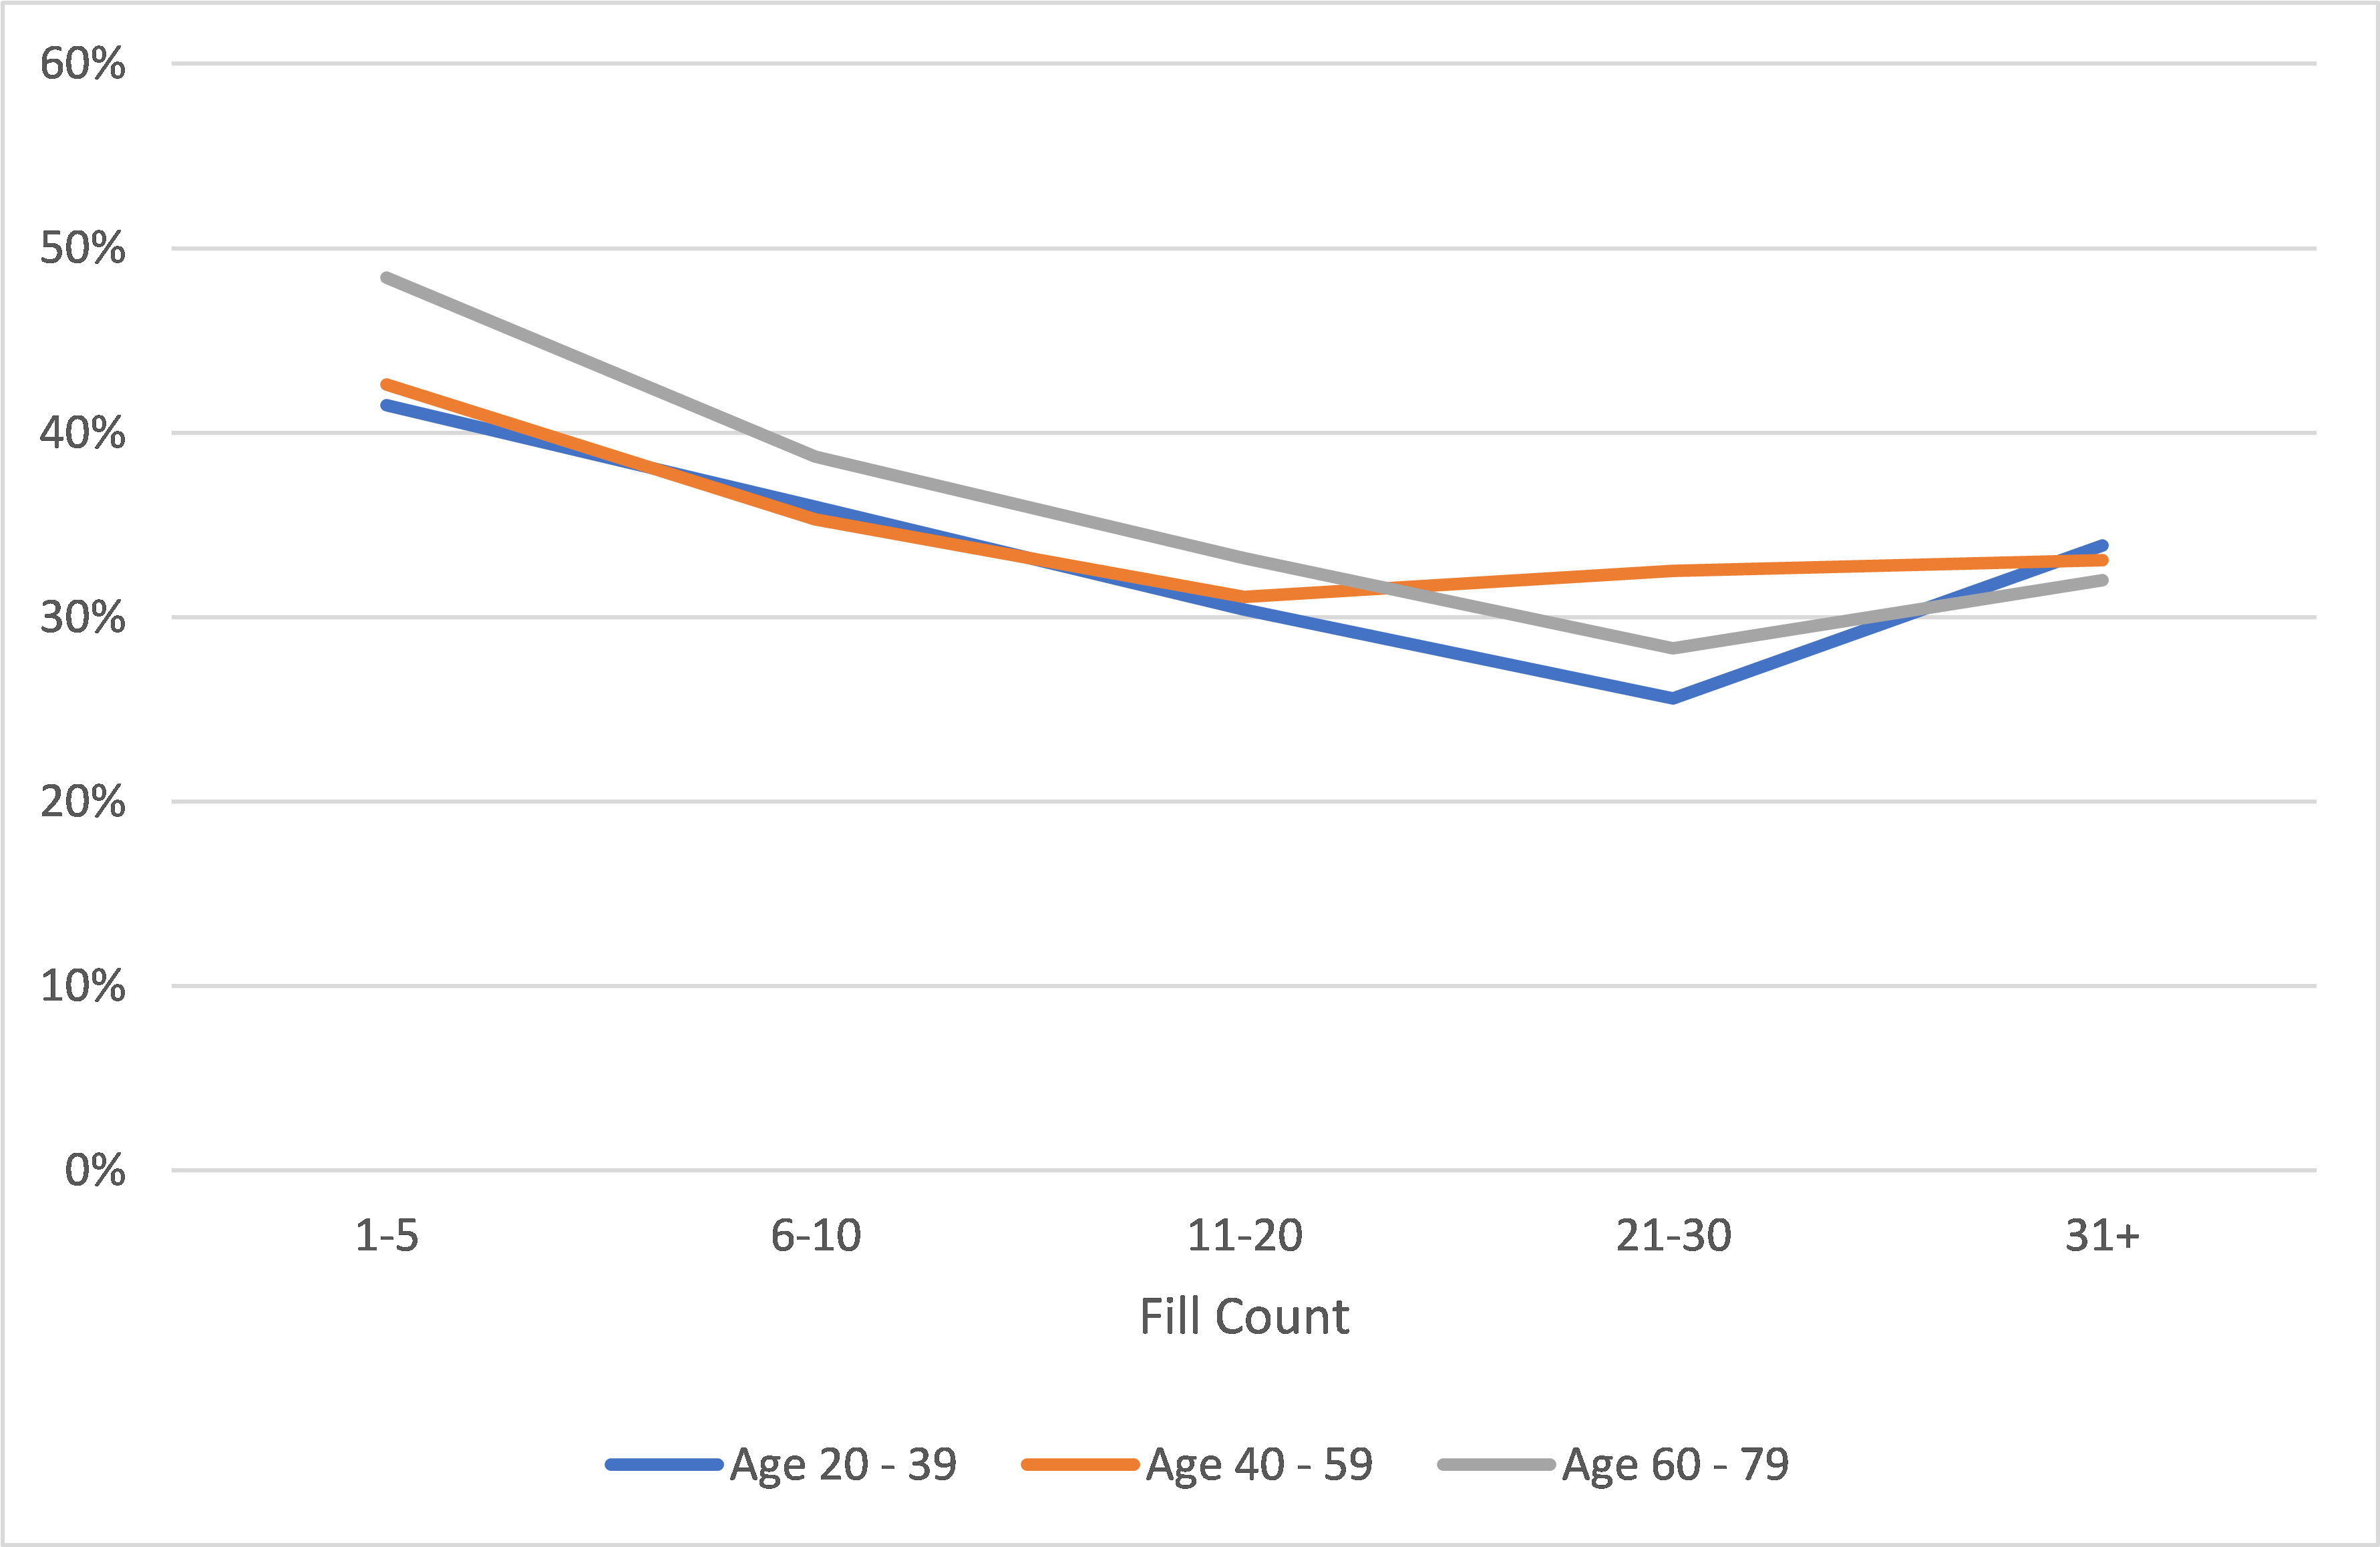
Figure 6. Exposure Distribution by Fill Count and Max Score Group
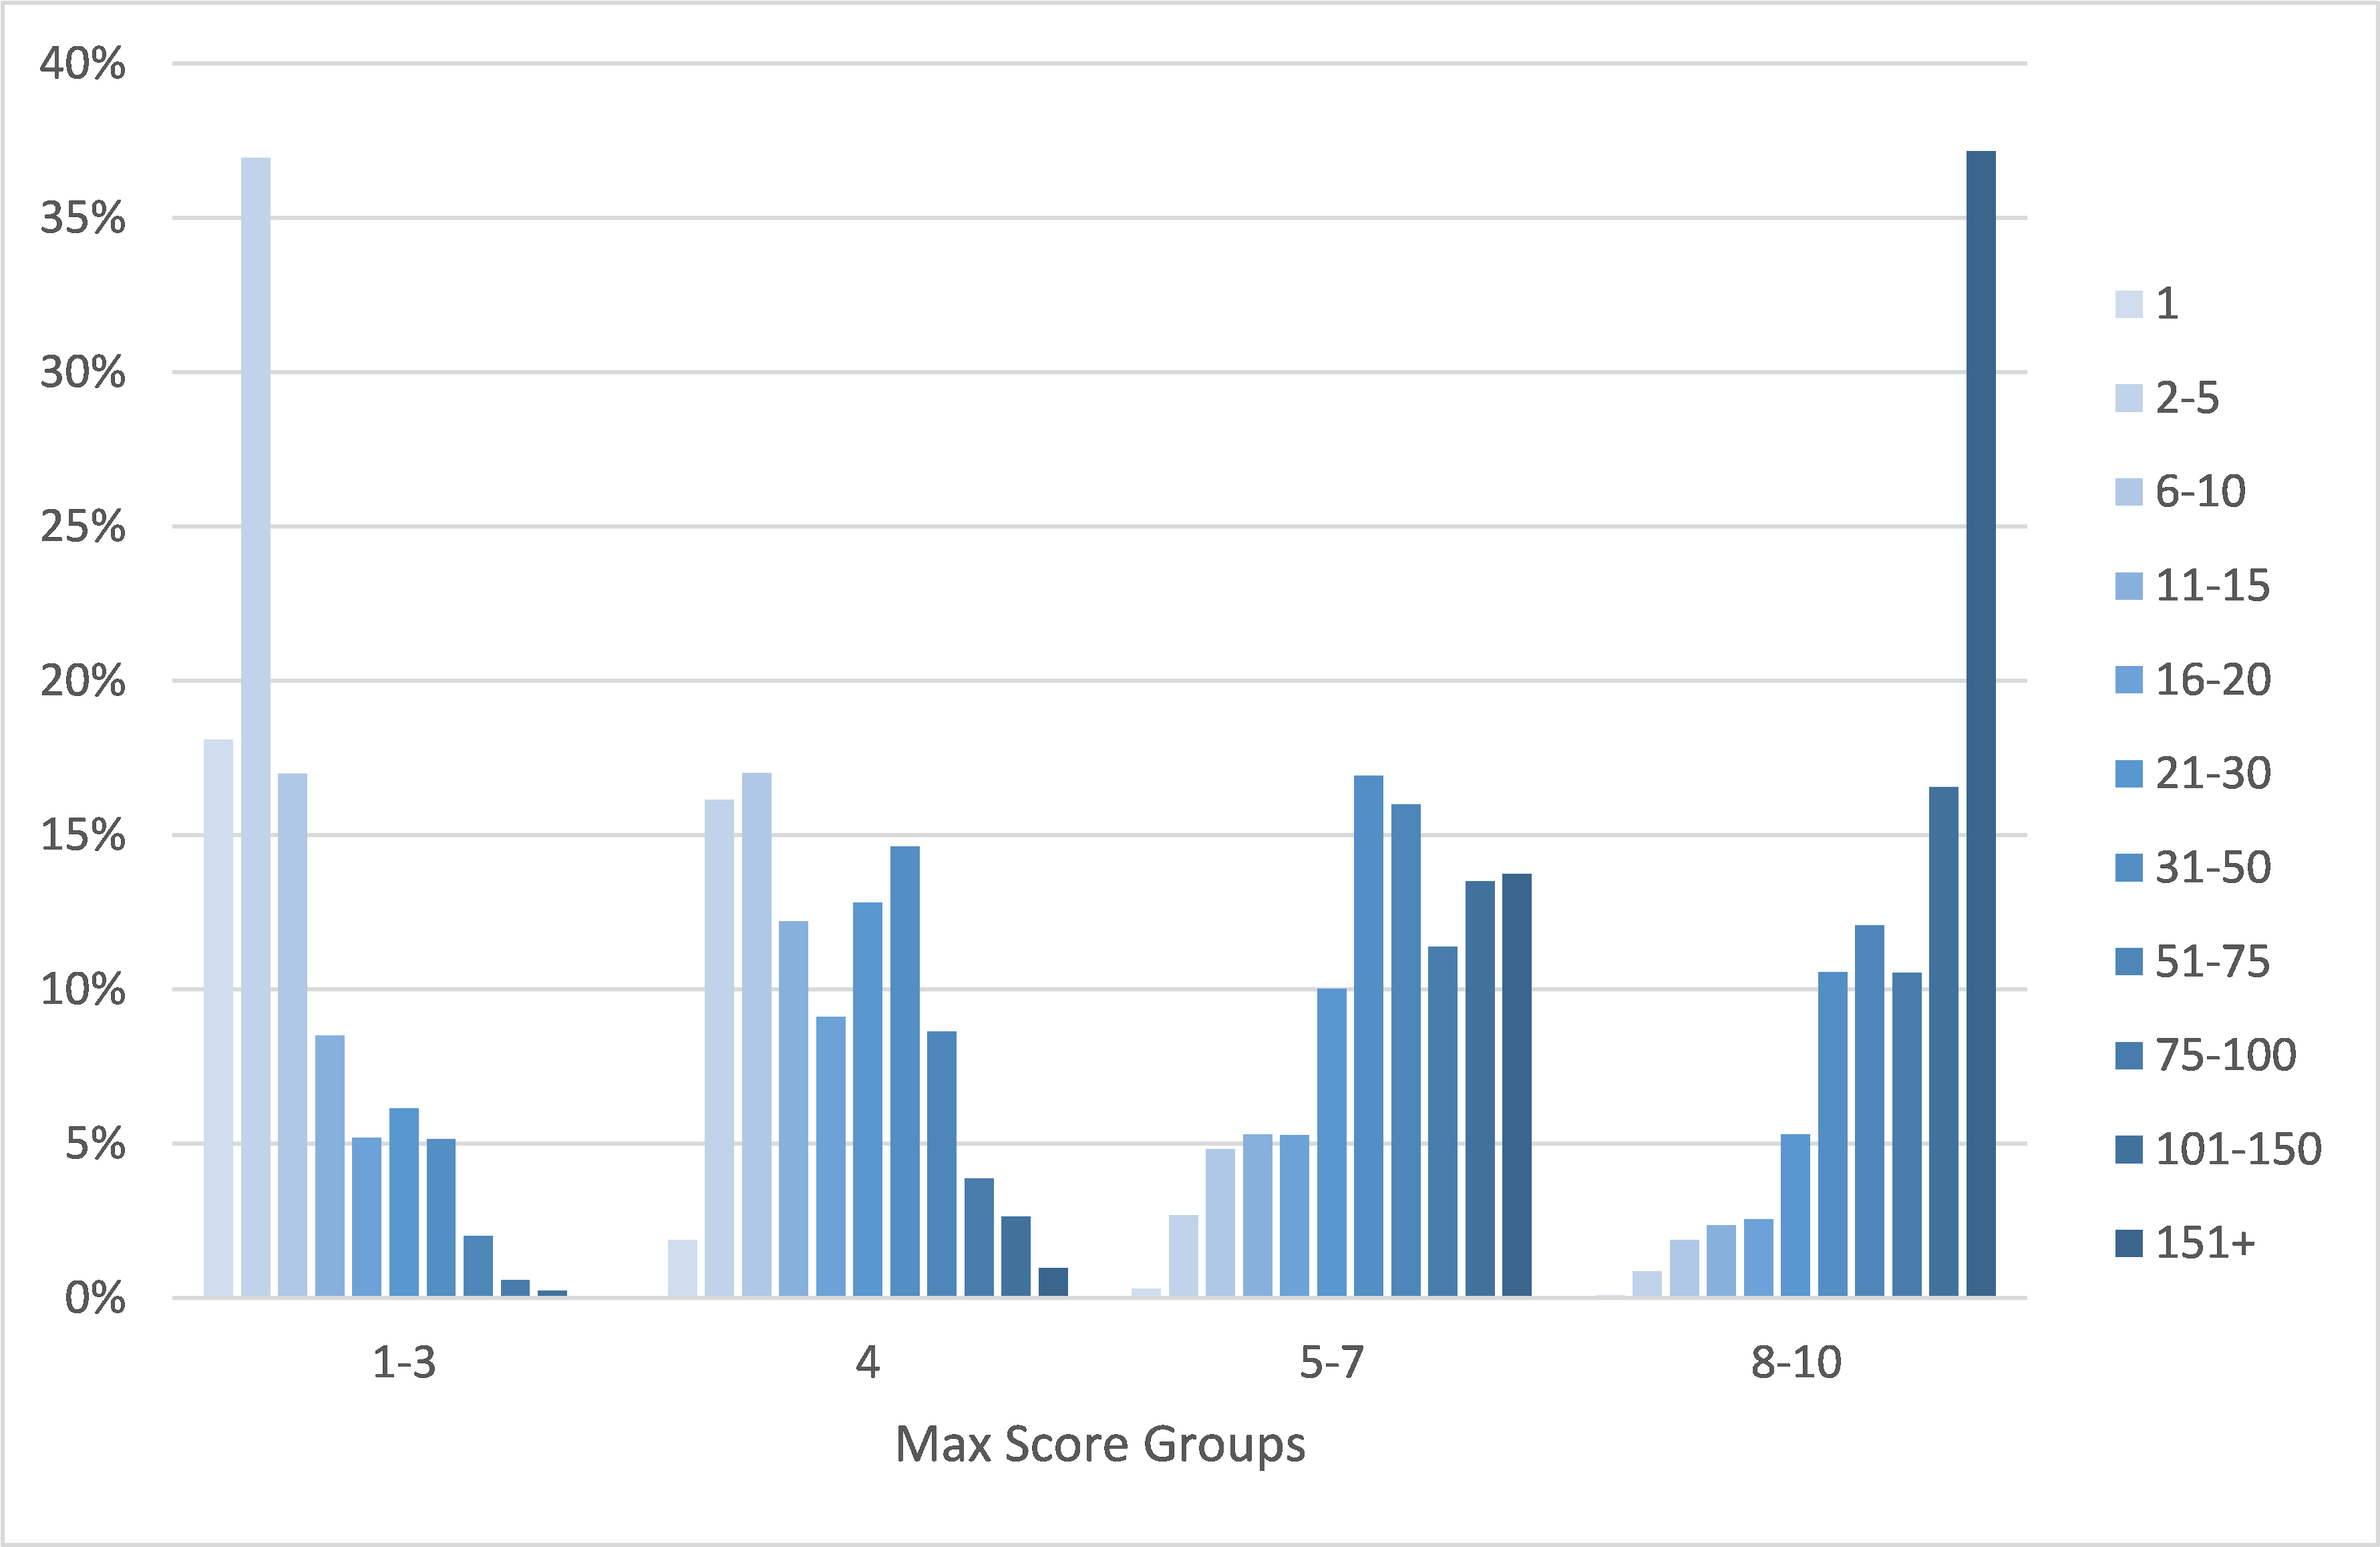
Figure 7: A/E by Fill Count and Time Since Most Recent Fill (Max Scores 1-3)
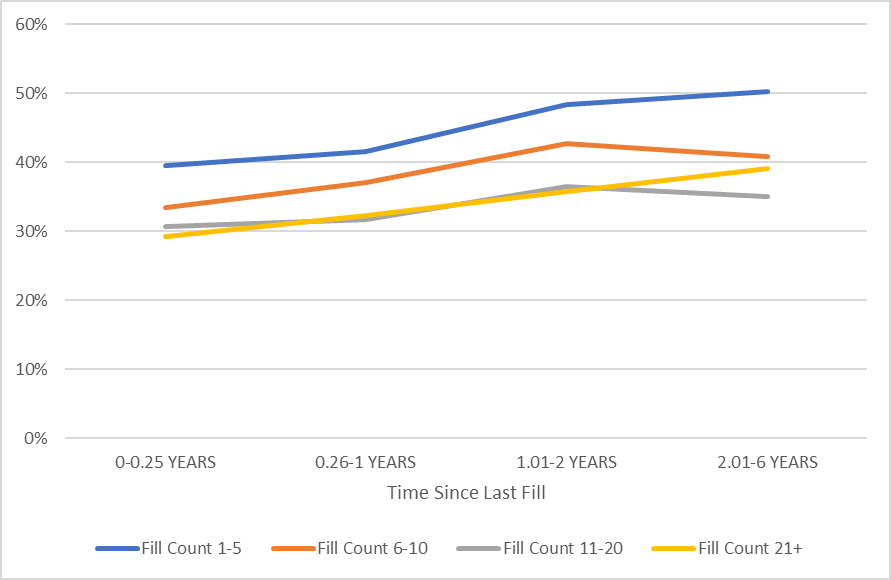
Recency and frequency of a history also affect mortality. In Figure 7, each mortality line represents fill counts in bands, with the x-axis representing the length of time since the most recent fill increases. For example, those with 1-5 fills for whom the most recent fill was within a quarter of a year of the evaluation date are represented by the leftmost point of the blue line. Their A/E is about 40%.
The slopes of the lines reveal that even with the same number of fills, not having a recent Rx history indicates higher risk. The lines have near- uniform trends, and the consistently higher A/Es for the lines representing lower fill counts conveys at any given level of recency, having a less robust Rx history indicates higher mortality. In other words, both recency and frequency are important considerations.
Prescription Histories, Risk and Predictive Models As demonstrated above, the max scores approach to evaluating prescription histories – that is, using the highest severity drug in a patient’s history to determine mortality – may not necessarily capture the full range of prescription drug history complexities for individuals. Predictive models, which can simultaneously consider severity, recency and frequency, along with many other factors, may produce risk assessments that better match actual mortality experience.
During the past 4 years, RGA has developed the Rx Predictive Model Risk Score (RxPM Risk Score) tool, which utilizes a broad range of aspects of a prescription history, including the max score, to predict mortality risk. Scores produced by this model range from 1 to 100. Each score represents 1% of the underlying population. A score of 1 indicates the 1% of people with the lowest mortality risk, and a score of 100 demonstrates the 1% of people with the highest mortality risk. The RxPM Risk Score has been found to be highly predictive of mortality risk.
Figure 8. A/E by RxPM Risk Score
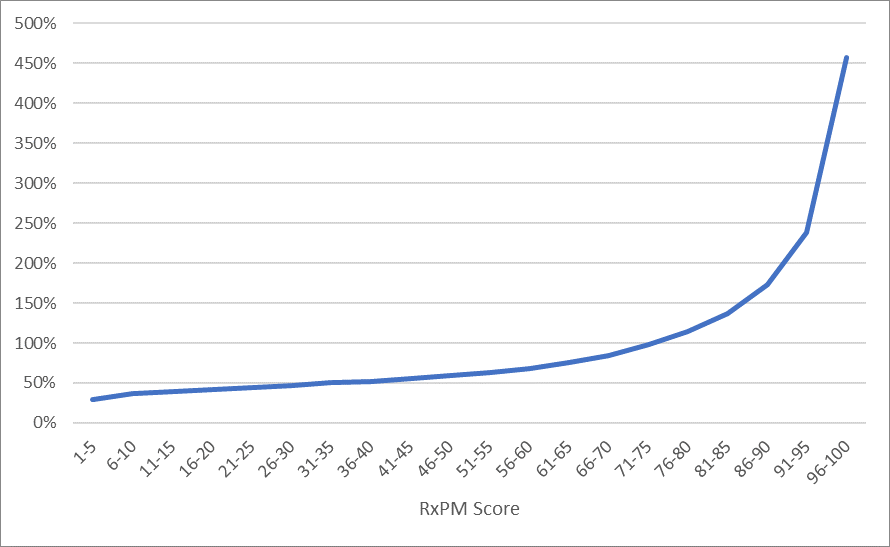
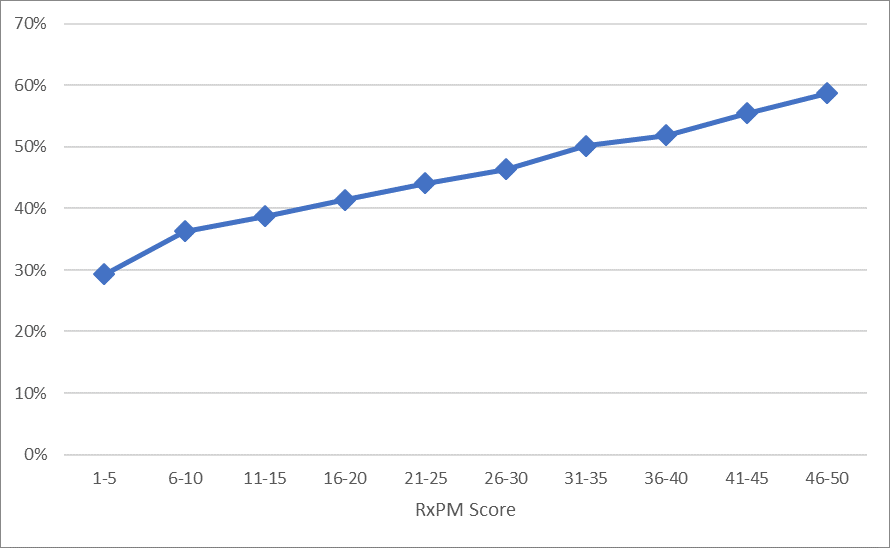
Figure 8 shows the mortality lift curve for the study dataset’s RxPM Risk Scores, with the curve for the scores of between 1 and 50 zoomed in on Figure 8a.
Mortality levels for those with RxPM Risk Scores of 96-100 are, as shown in Figure 8, more than 15 times higher than for those with RxPM Risk Scores of 1-5.
The proportion of those with RxPM Risk Scores of 1-50 were found to be approximately the same – about 50% – as the proportion with max scores of 1-4. How- ever, for certain older-age bands, those with RxPM Risk Scores of 1-50 comprised a higher percentage of the total dataset than did those with max scores of 1-4.
The mortality lift curve shown in Figure 8a is clearly increasing monotonically by RxPM Risk Scores. This suggests the RxPM Risk Score can be an effective tool for identifying those with low mortality risks.
Figure 8a. A/E by RxPM Risk Score for Scores 50 and Lower
To further illustrate, let’s look at two cases: both 70-year-old males with only low-severity medications in their prescription histories.
Case 1 represents a 70-year-old male with a benign history of allergies, constipation, a skin condition, and colds or other minor infections. He has a history of regular doctor visits for the benign conditions. His max score is 3 and RxPM Risk Score is 12, representing multiple fills and recent fills, indicating recent doctor visits.
Case 1.
Medications | 2017 | 2018 | 2019 | 2020 |
|---|
Loratadine 10 MG tablet | | | | 1 fill |
Methylprednisolone 4 MG dosepk | | | | 1 fill |
Mometasone furoate 0.1% cream | | 1 fill | 1 fill | 1 fill |
Polyethylene glycol 3350 powd | 1 fill | | | 1 fill |
Amoxicillin 875 MG tablet | | 1 fill | | 1 fill |
Case 2 represents a 70-year-old male who has had only one prescription fill during the past several years for what appears to have been a cold or other minor infection. Our study shows as the age of an individual increases, a lack of prescription fills (which appears to be a proxy for medical follow-up), adversely impacts mortality. The max score is 1 for this gentleman, but his RxPM Risk Score is 50 due to a combination of factors, which in this case included age and a light prescription history.
Case 2.
Medications | 2020 |
|---|
Amoxicillin 500 MG capsule | 1 fill |
Conclusions
When evaluating mortality risk using prescription histories, it is important to consider more than just the most severe medication taken. This is particularly true for those with only low-severity medications in their histories. Mortality for these individuals could be equal to or slightly higher than those taking moderate-severity medications, especially for older individuals. This group tends to have lighter usage of prescription medications and is also less likely to have recent information available in their history. When no high-severity medication is present, less robust histories are associated with additional mortality risk.