An increase in opioid misuse contributed to a rise in overdose mortality in 2020.
The ongoing epidemic from opioid abuse has had significant effects on mortality experience in the United States. Using the Centers for Disease Control and Prevention's Multiple Cause of Death mortality data (MCOD), RGA has analyzed U.S. overdose mortality, aggregating experience data by several demographic characteristics to better understand opioid-related deaths and the potential impact on the insurance industry. Understanding the key drivers of opioid-related mortality is important to insurers studying mortality experience for pricing and underwriting new business. This analysis explored the opioid-related mortality trends during the COVID-19 pandemic, as well as the rising concern of fentanyl and synthetic opioid misuse.
This report extends an analysis of opioid mortality risk published at the end of 2019 and includes data through 2020 that was obtained in early 2022.
Key findings:
- Opioid-related deaths were on the rise for more than a decade before leveling off between 2018-2019. However, opioid-related deaths were much higher in 2020 than in previous years, with a peak in May 2020, coinciding with social isolation measures early in the COVID-19 pandemic.
- While individuals of all educational attainment levels experienced increases in opioid-related mortality rates, those without any college-level education exhibited higher and more rapidly increasing opioid-related mortality rates.
- Overdoses involving fentanyl and synthetic opioids have continued to increase, while other opioid-related drug overdoses have remained constant or decreased. This is especially impactful to the experience of those at younger ages, who are more likely to have an opioid-related death involving fentanyl and synthetic opioids.
- Opioid-related mortality rates vary by age, sex, marital status, and occupation. Groups exhibiting higher mortality rates relative to their peers include males, people who have never been married, workers in construction-related jobs, and people who are not university-educated. Opioid-related death rates generally decline with age for university-educated males, whereas rates for females peak in middle age.
Overdose deaths increased drastically in 2020 after experiencing a slowdown in 2018-2019.
The increase in overdose deaths was primarily driven by opioid-related deaths.
Total overdose deaths have generally trended upward since 2005, with a recent and sudden spike in 2020. This spike was more pronounced for opioid drugs than for non-opioid drugs.
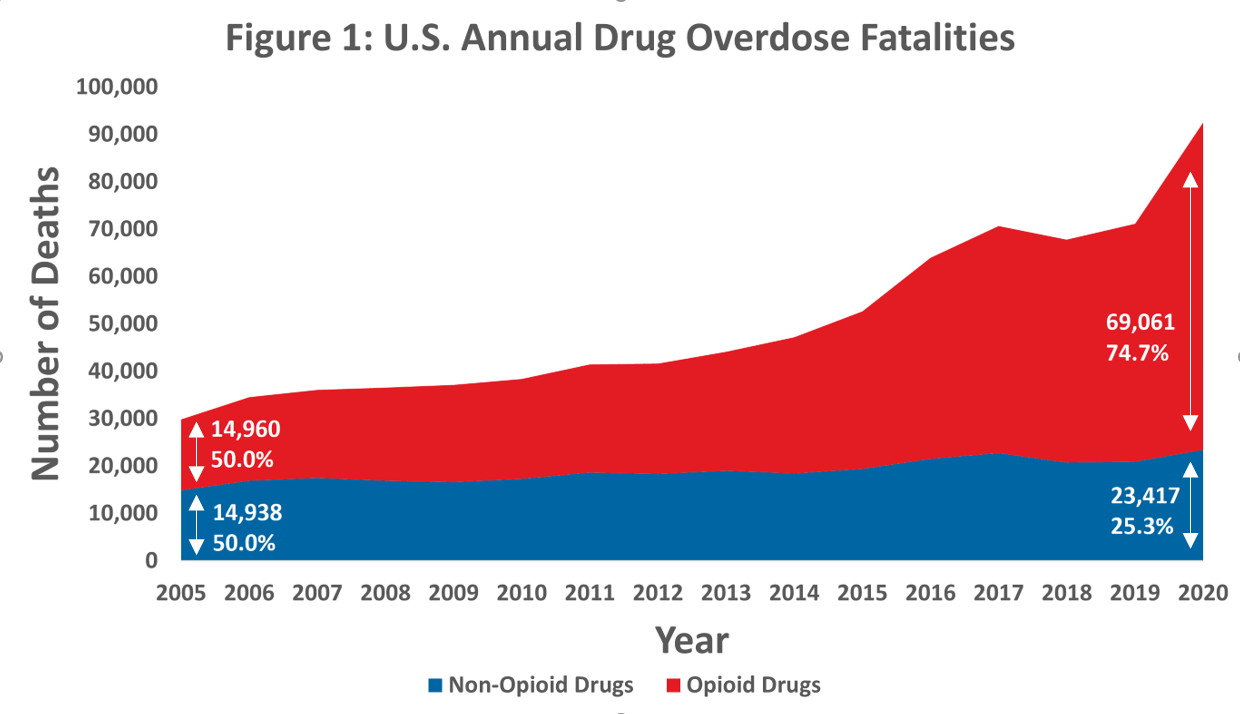 Source: RGA analysis of mortality data from the MCOD.
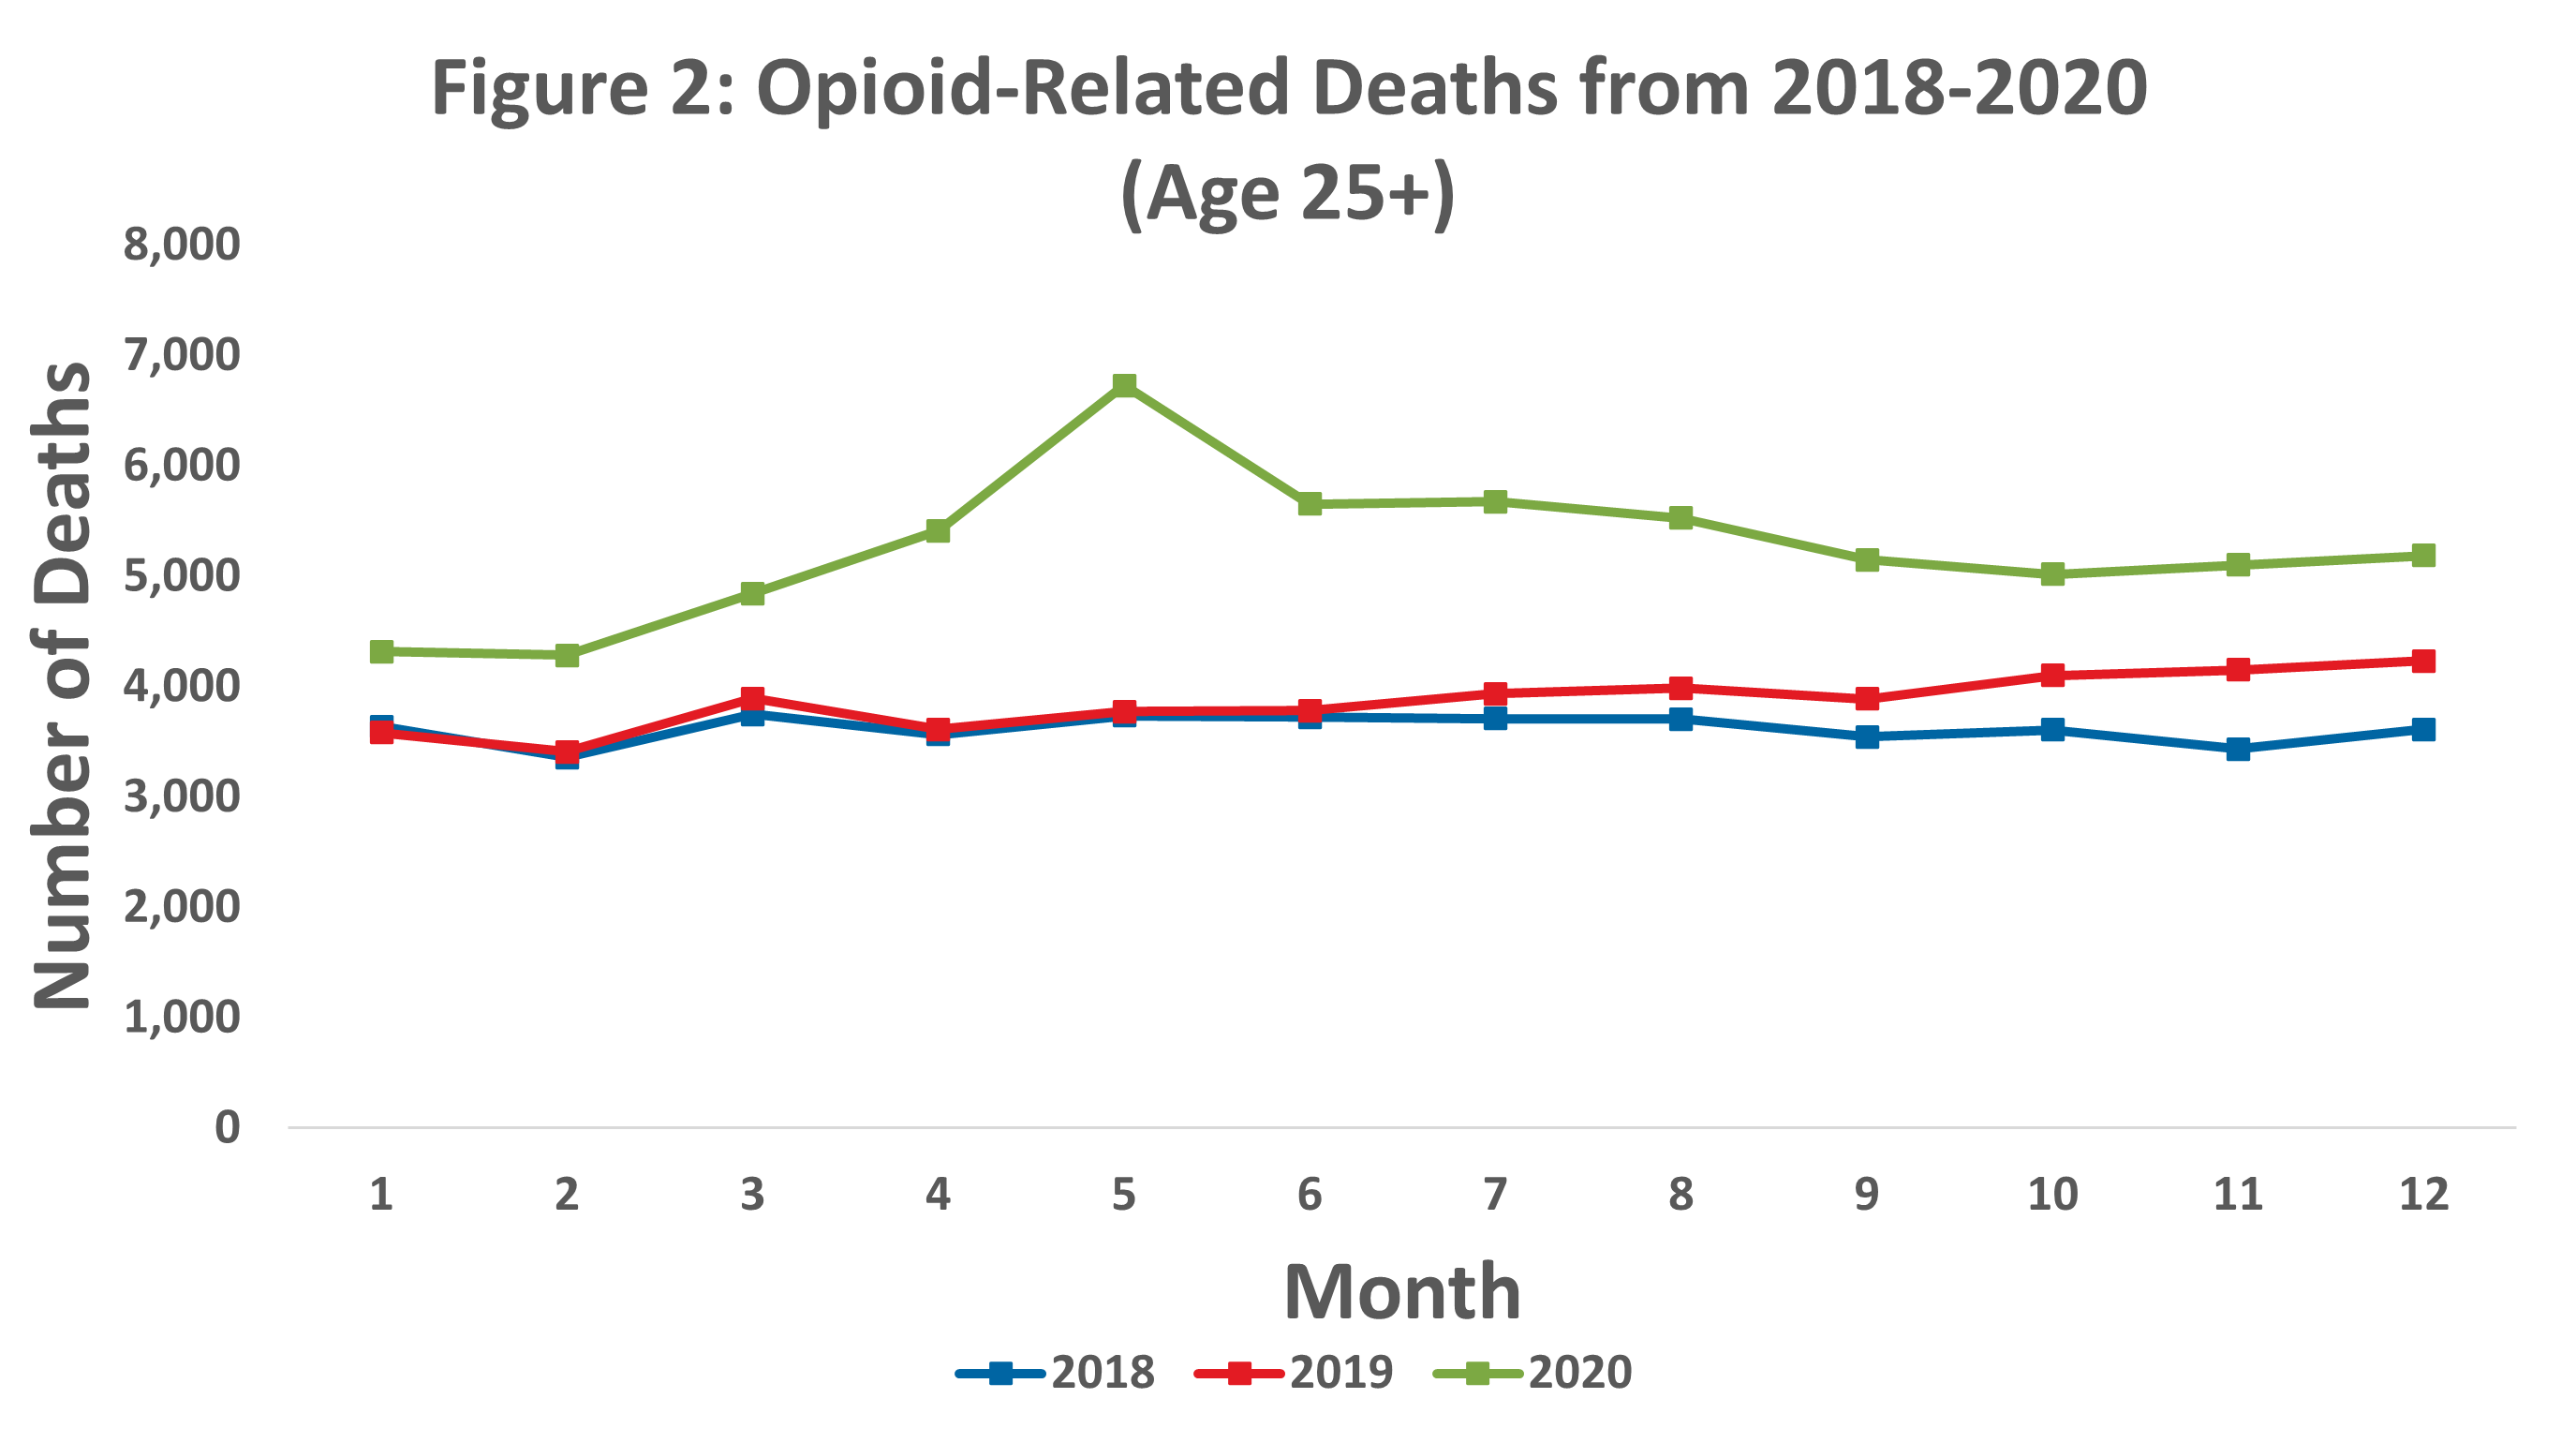
Opioid-related deaths peaked in May 2020.
In May 2020, while many individuals remained in isolation due to the COVID-19 pandemic, opioid-related deaths spiked. While the number of opioid-related deaths declined after May 2020, the number of opioid deaths was consistently higher each month of 2020 relative to the same months in 2018 and 2019.
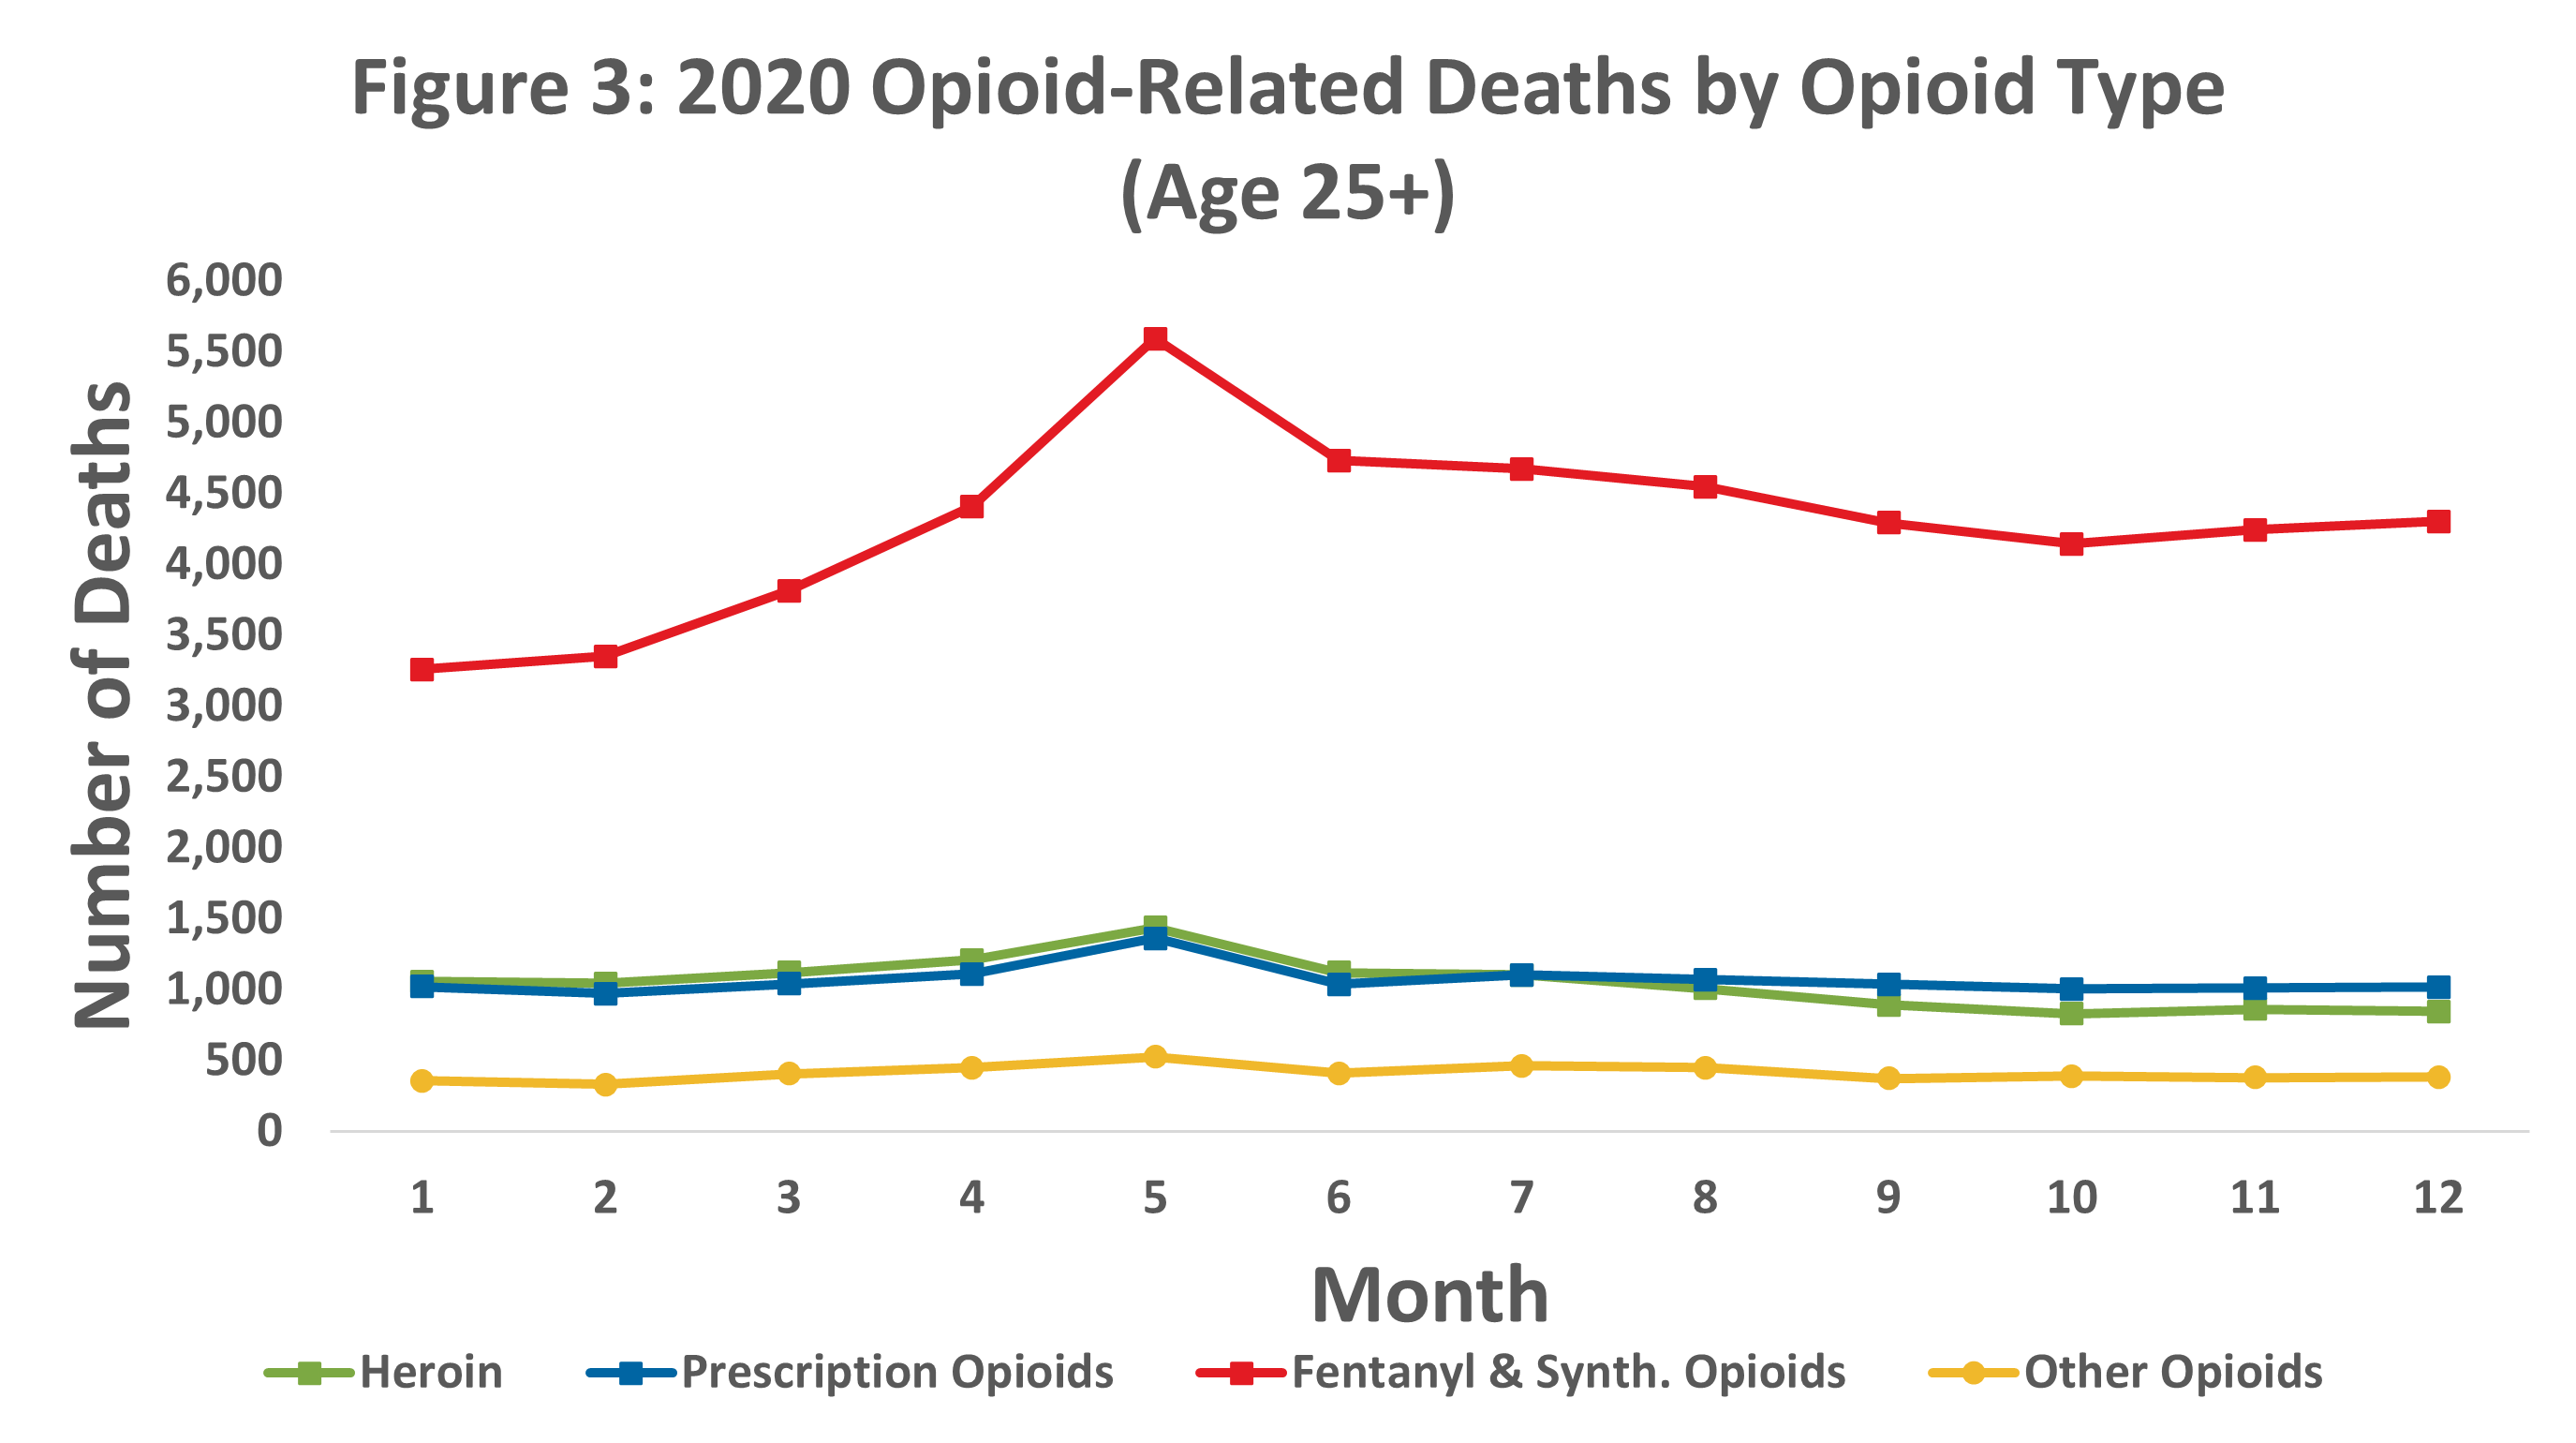
Source: RGA analysis of mortality data from the MCOD.Fentanyl and synthetics were the most common type of opioid drug contributing to 2020 deaths.
While deaths from all opioid drug types peaked in May 2020, fentanyl and synthetic opioids experienced the largest spike. Fentanyl and synthetic opioid deaths nearly doubled from January 2020 to May 2020 and totaled more than three times the number of prescription opioid deaths throughout 2020.
 Source: RGA analysis of mortality data from the MCOD.
Opioid-related mortality experience varies with educational attainment, which is helpful to understand the implications of the rising overdose mortality rates on the insurance industry.
People with lower levels of education experienced higher and more rapidly increasing opioid-related mortality rates.
People from all education levels experienced an increase in opioid-related mortality rates over the past decade; however, this increase was much more dramatic for people with lower levels of education. Individuals without any college-level education experienced the highest opioid-related mortality rates in 2020, nearly 11 times the rate of individuals who have at least a bachelor's degree.
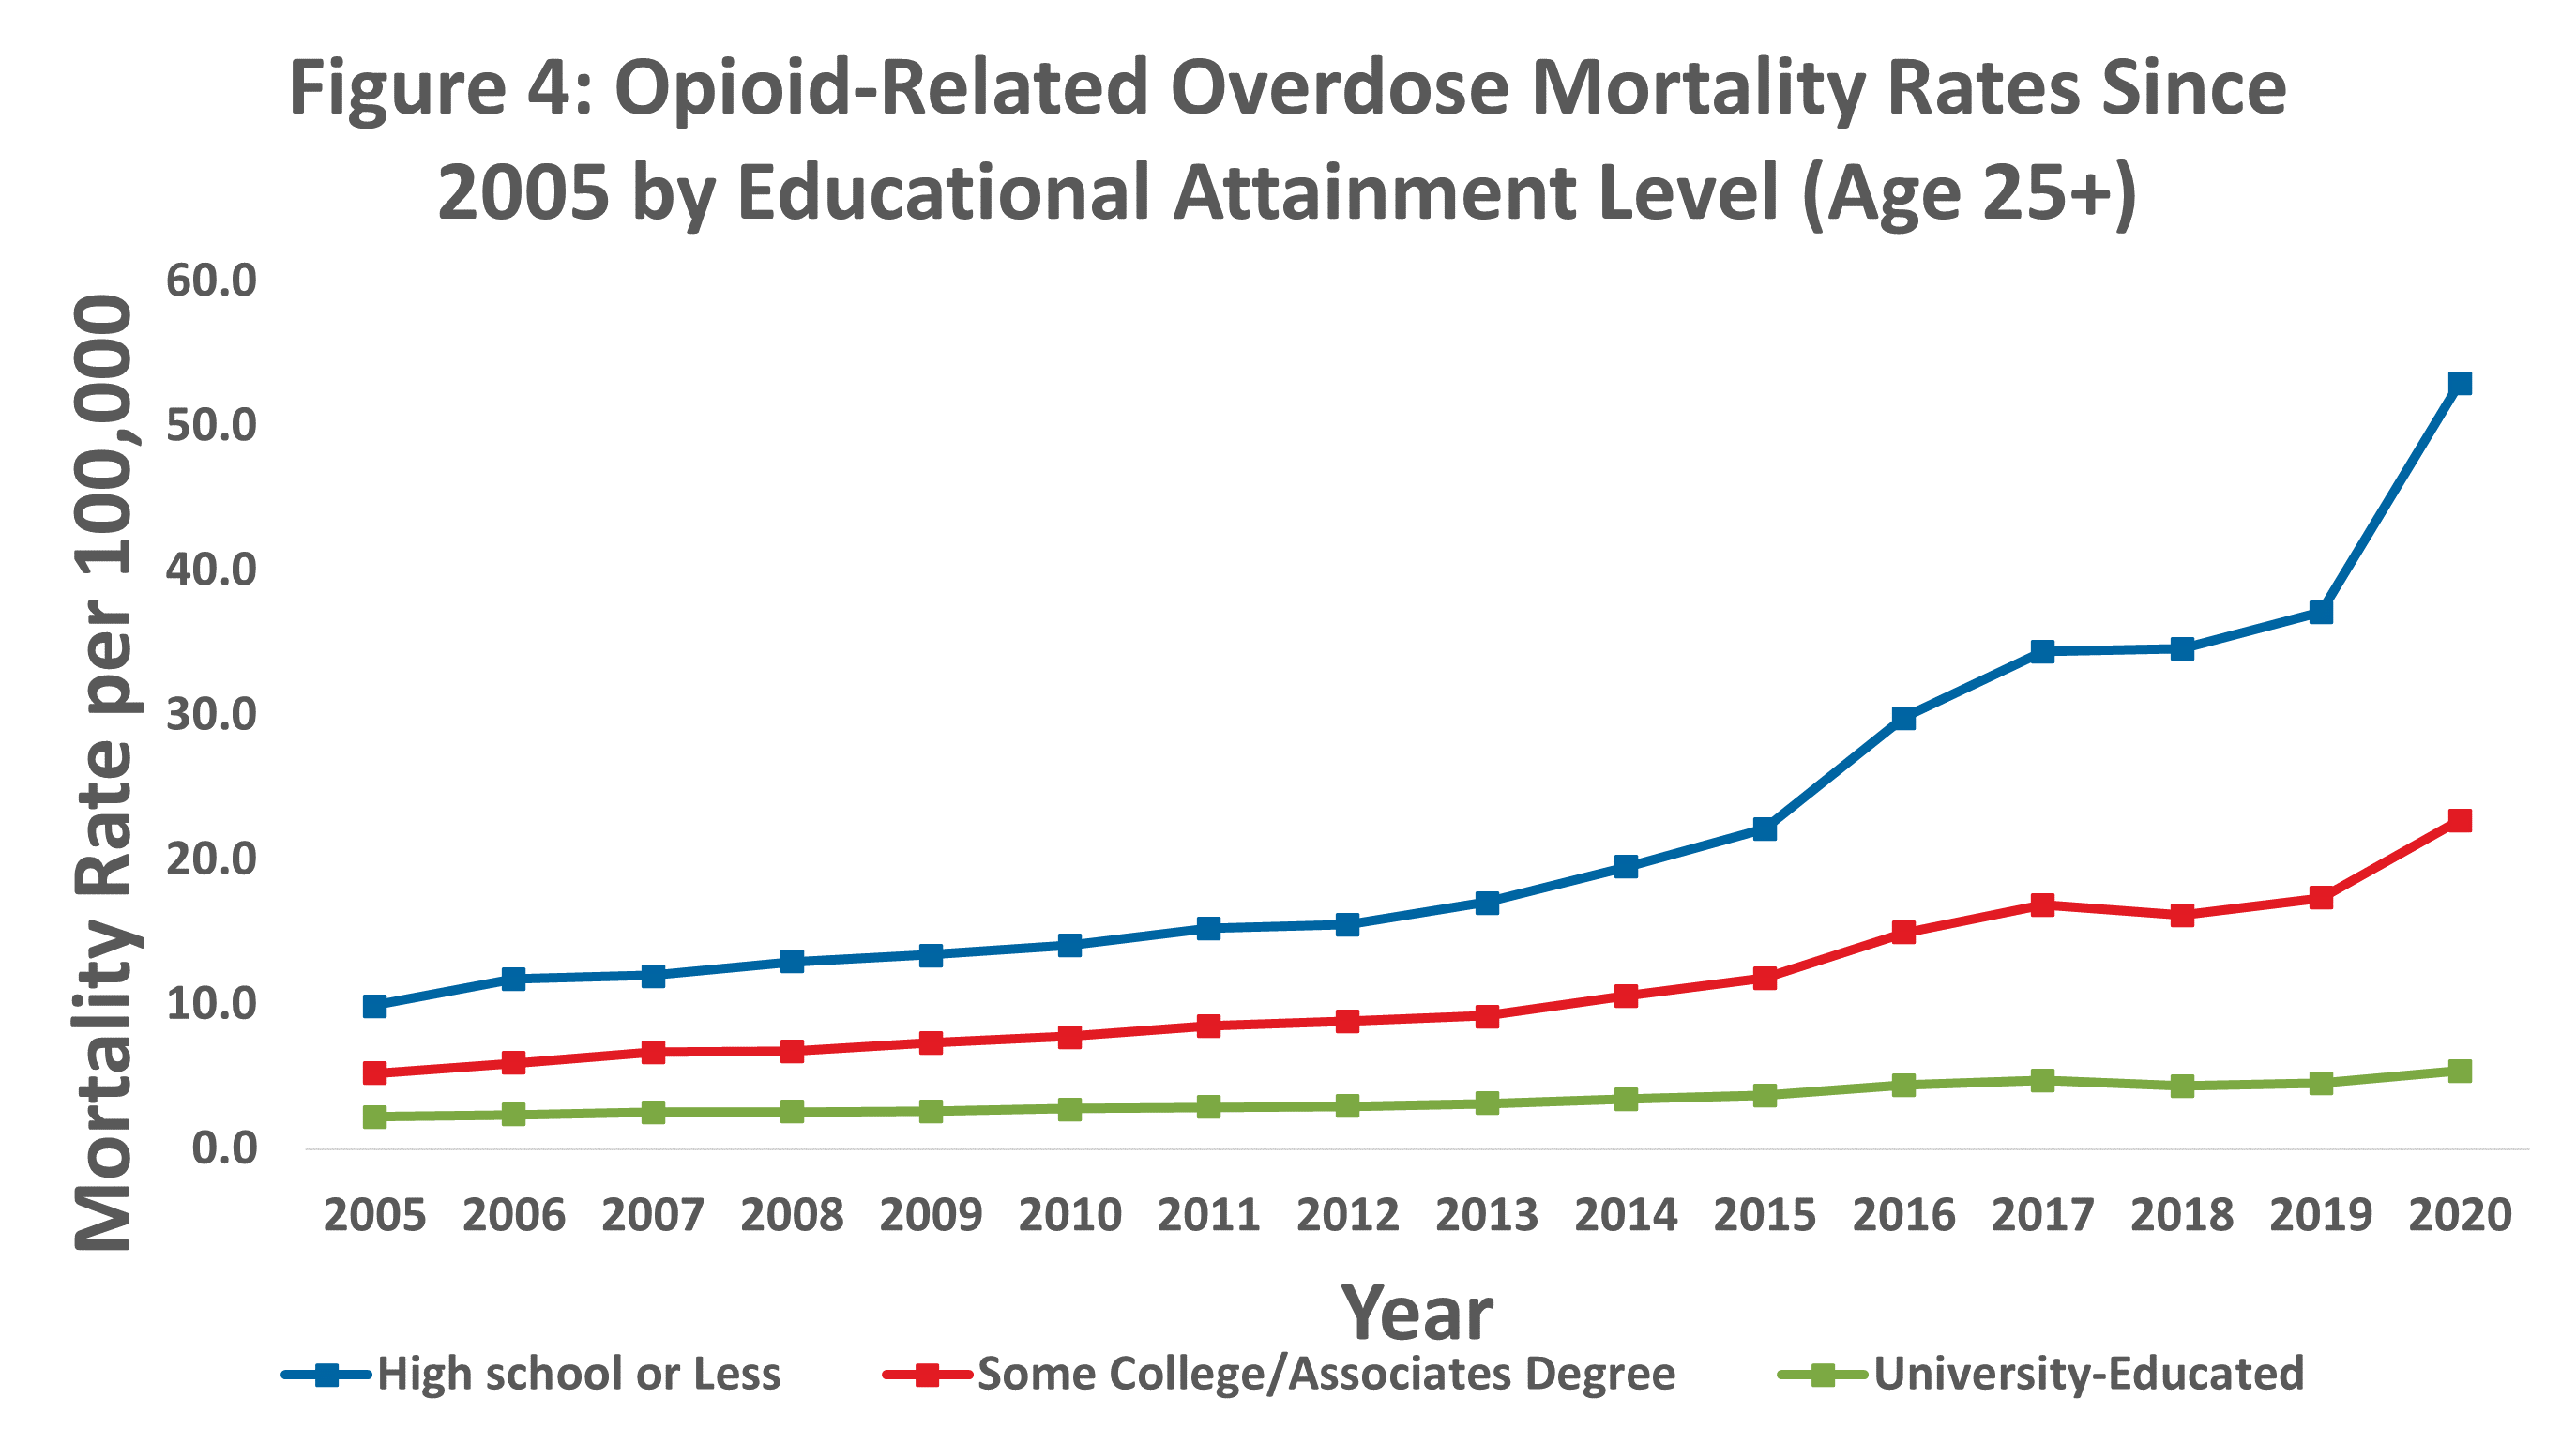
Source: RGA analysis of mortality data from the MCOD and population data from the U.S. Census Bureau.
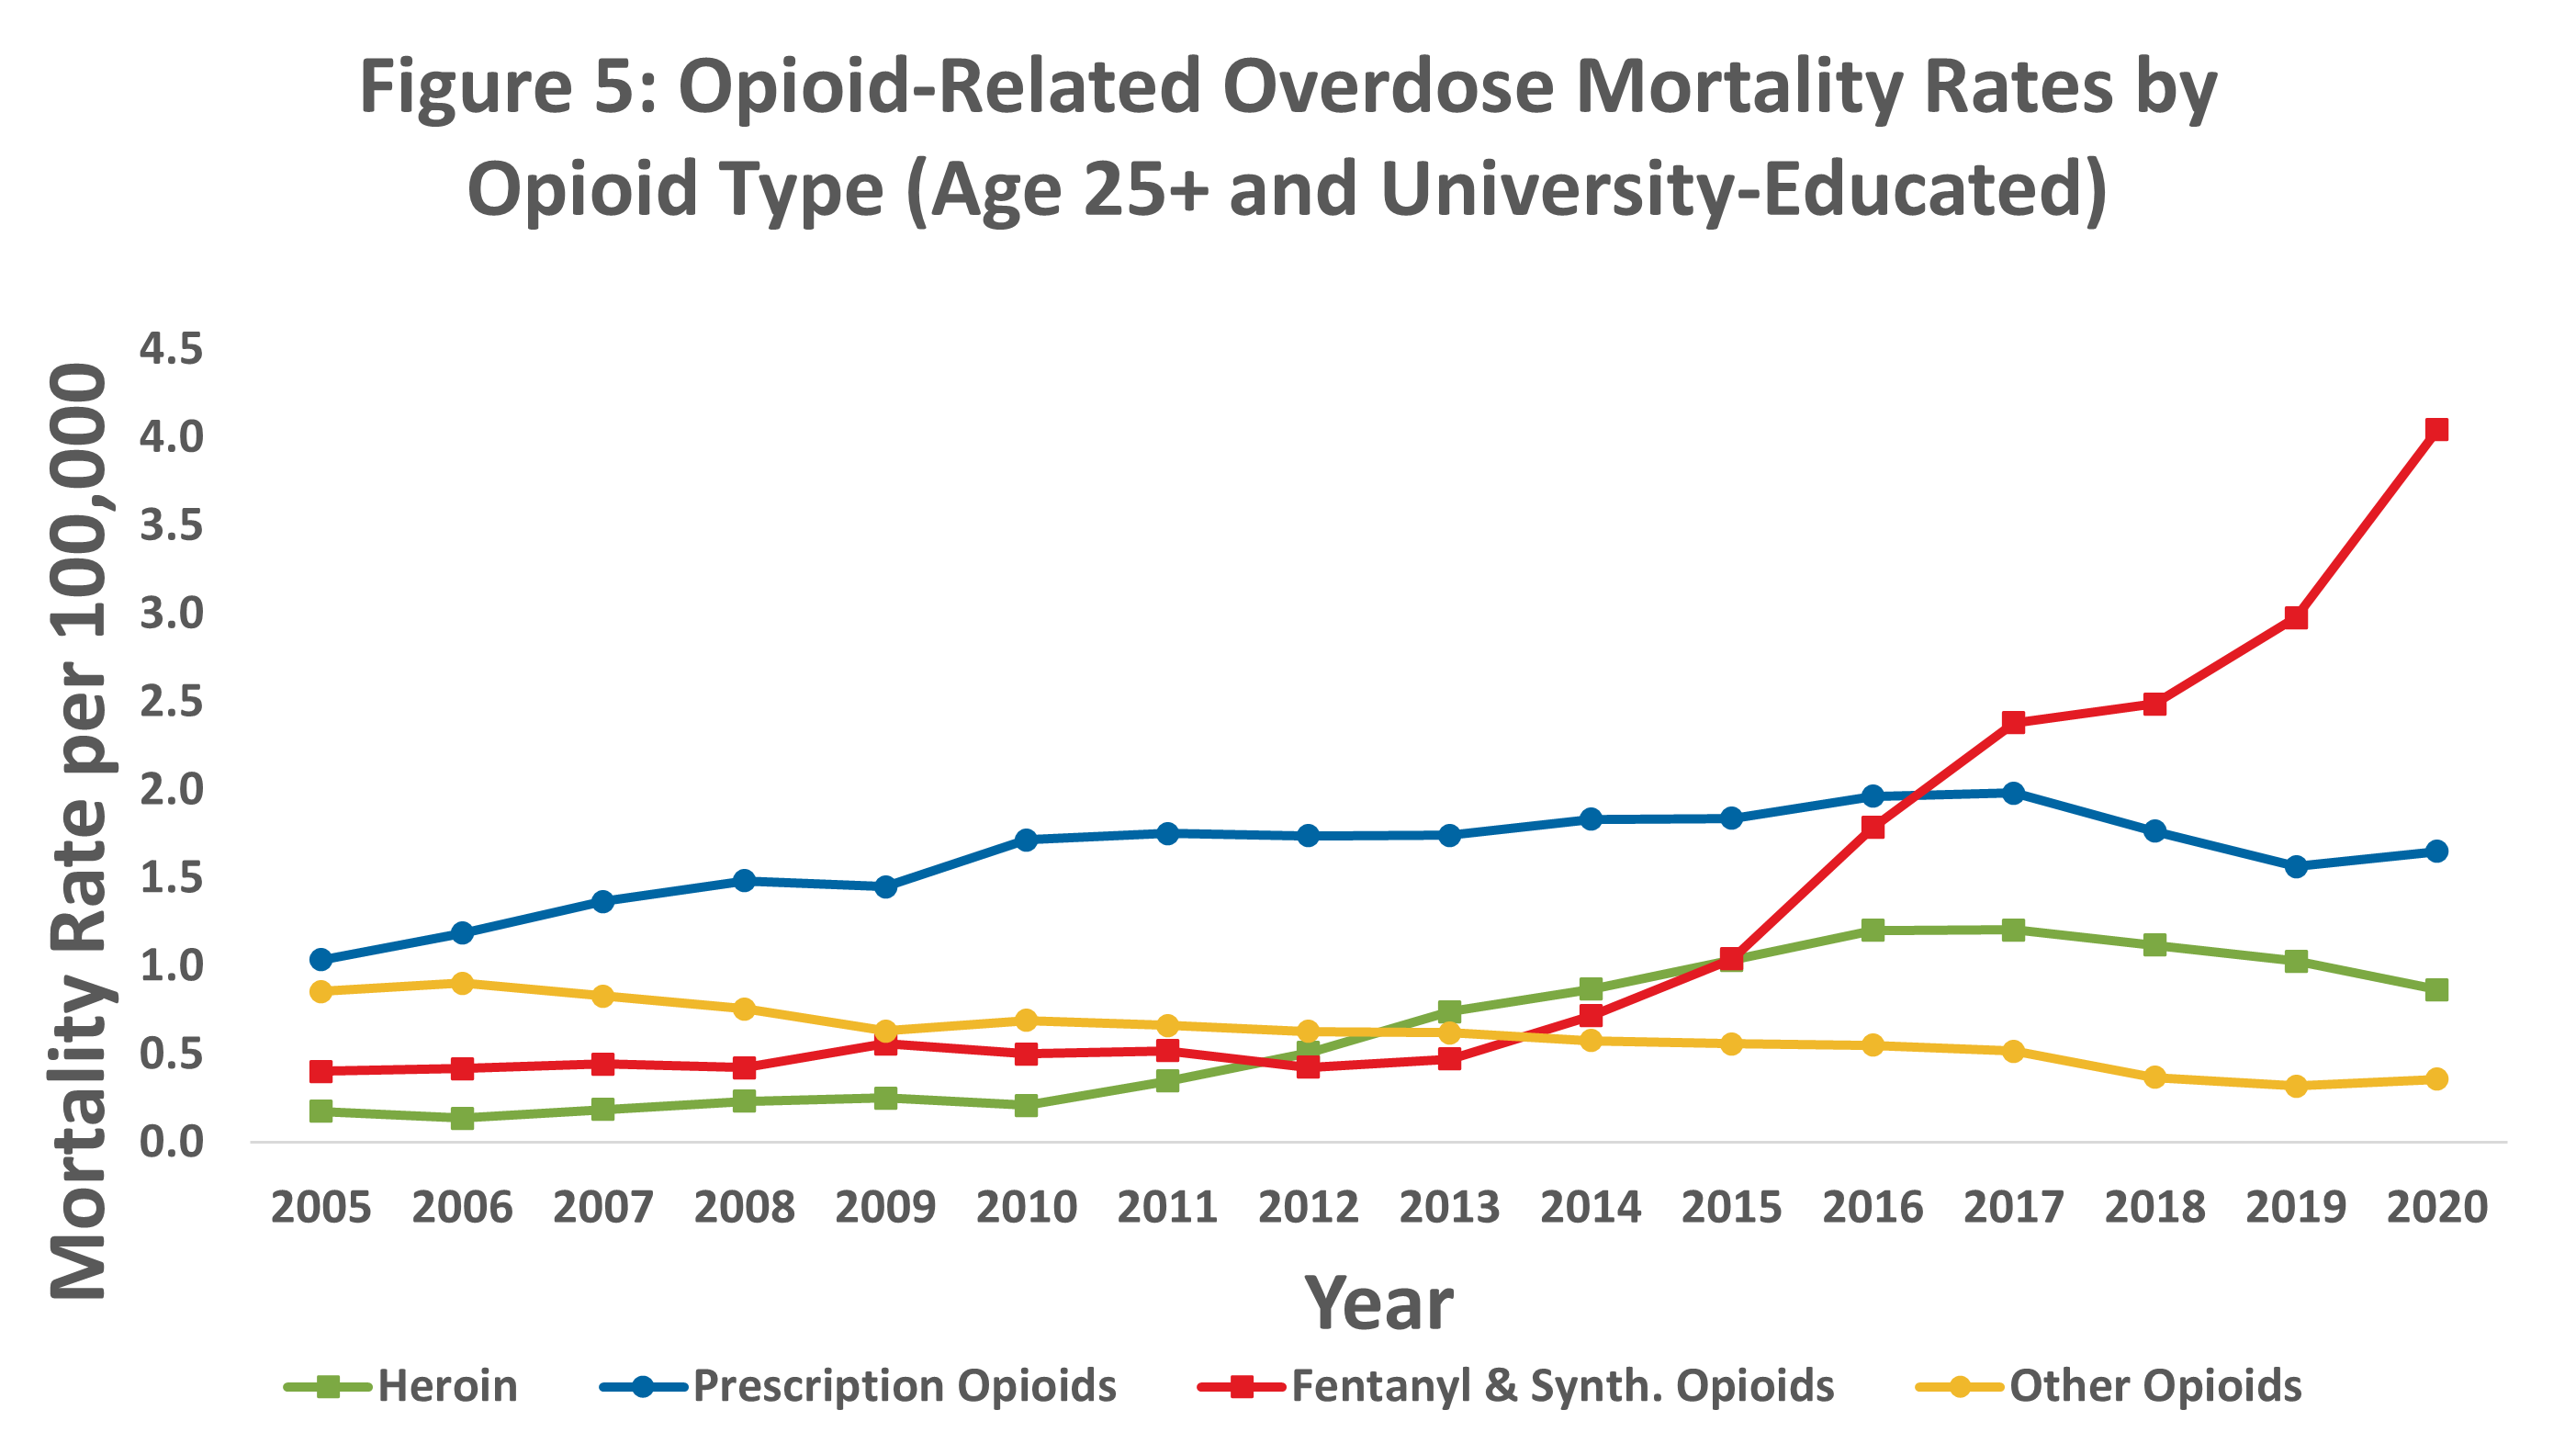
Dramatic increases in mortality rates from fentanyl and synthetic opioids were the driving factor of opioid-related mortality experience for university-educated people in recent years.
For university-educated individuals, the fentanyl and synthetic opioid overdose rate has followed a sharp, upward trend since 2013. Conversely, the overdose rates for heroin, prescription, and other opioids have generally declined or remained constant.
 Source: RGA analysis of mortality data from the MCOD and population data from the U.S. Census Bureau.
Chart note: University-educated in this analysis consists of United States civilian non-institutionalized population with bachelor’s, master’s, professional, and doctorate degrees. Excludes associate, vocational, and occupational degrees.
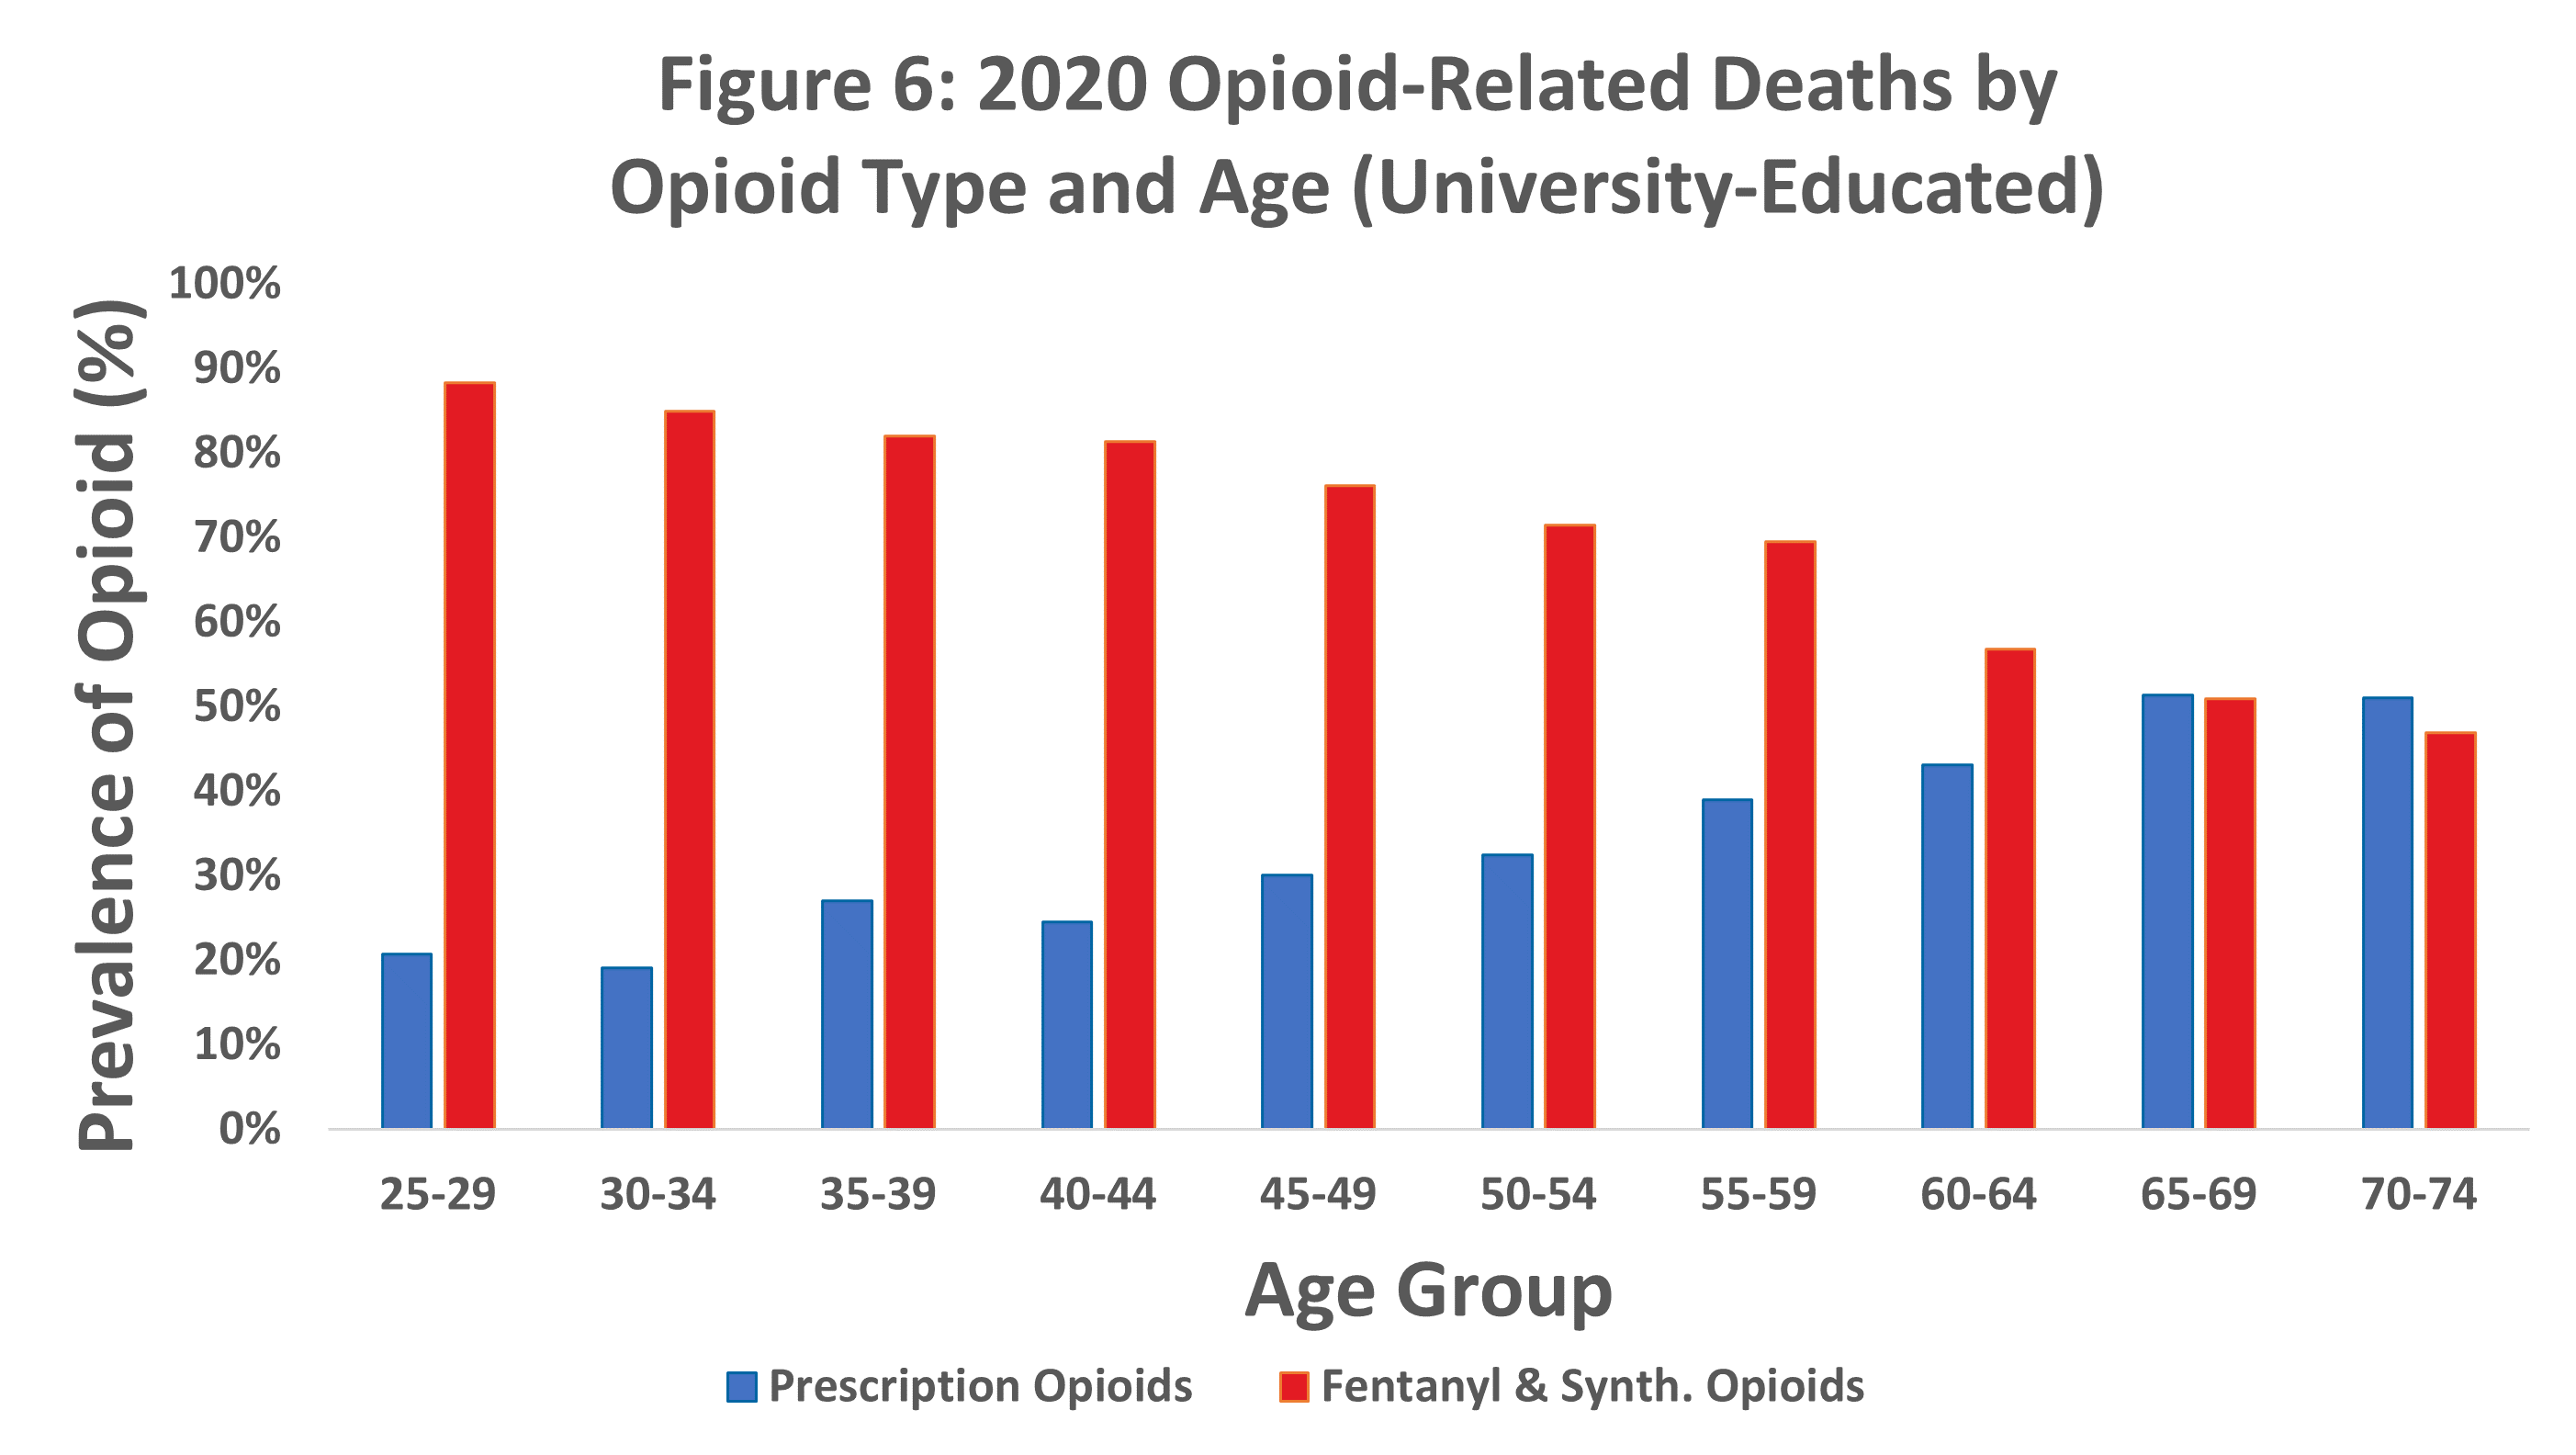
Younger individuals with university degrees were more likely to have an opioid-related death due to synthetic opioids.
Most opioid-related deaths in 2020 involved synthetic opioids, especially at younger ages. The proportion of prescription opioid deaths increases with age.
Source: RGA analysis of mortality data from the MCOD.
Chart note: Some deaths involved more than one opioid, so the sum of the prevalence of all opioid types may be larger than 100%.
Chart note: University-educated in this analysis consists of United States civilian non-institutionalized population with bachelor's, master's, professional, and doctorate degrees. Excludes associate, vocational, and occupational degrees.
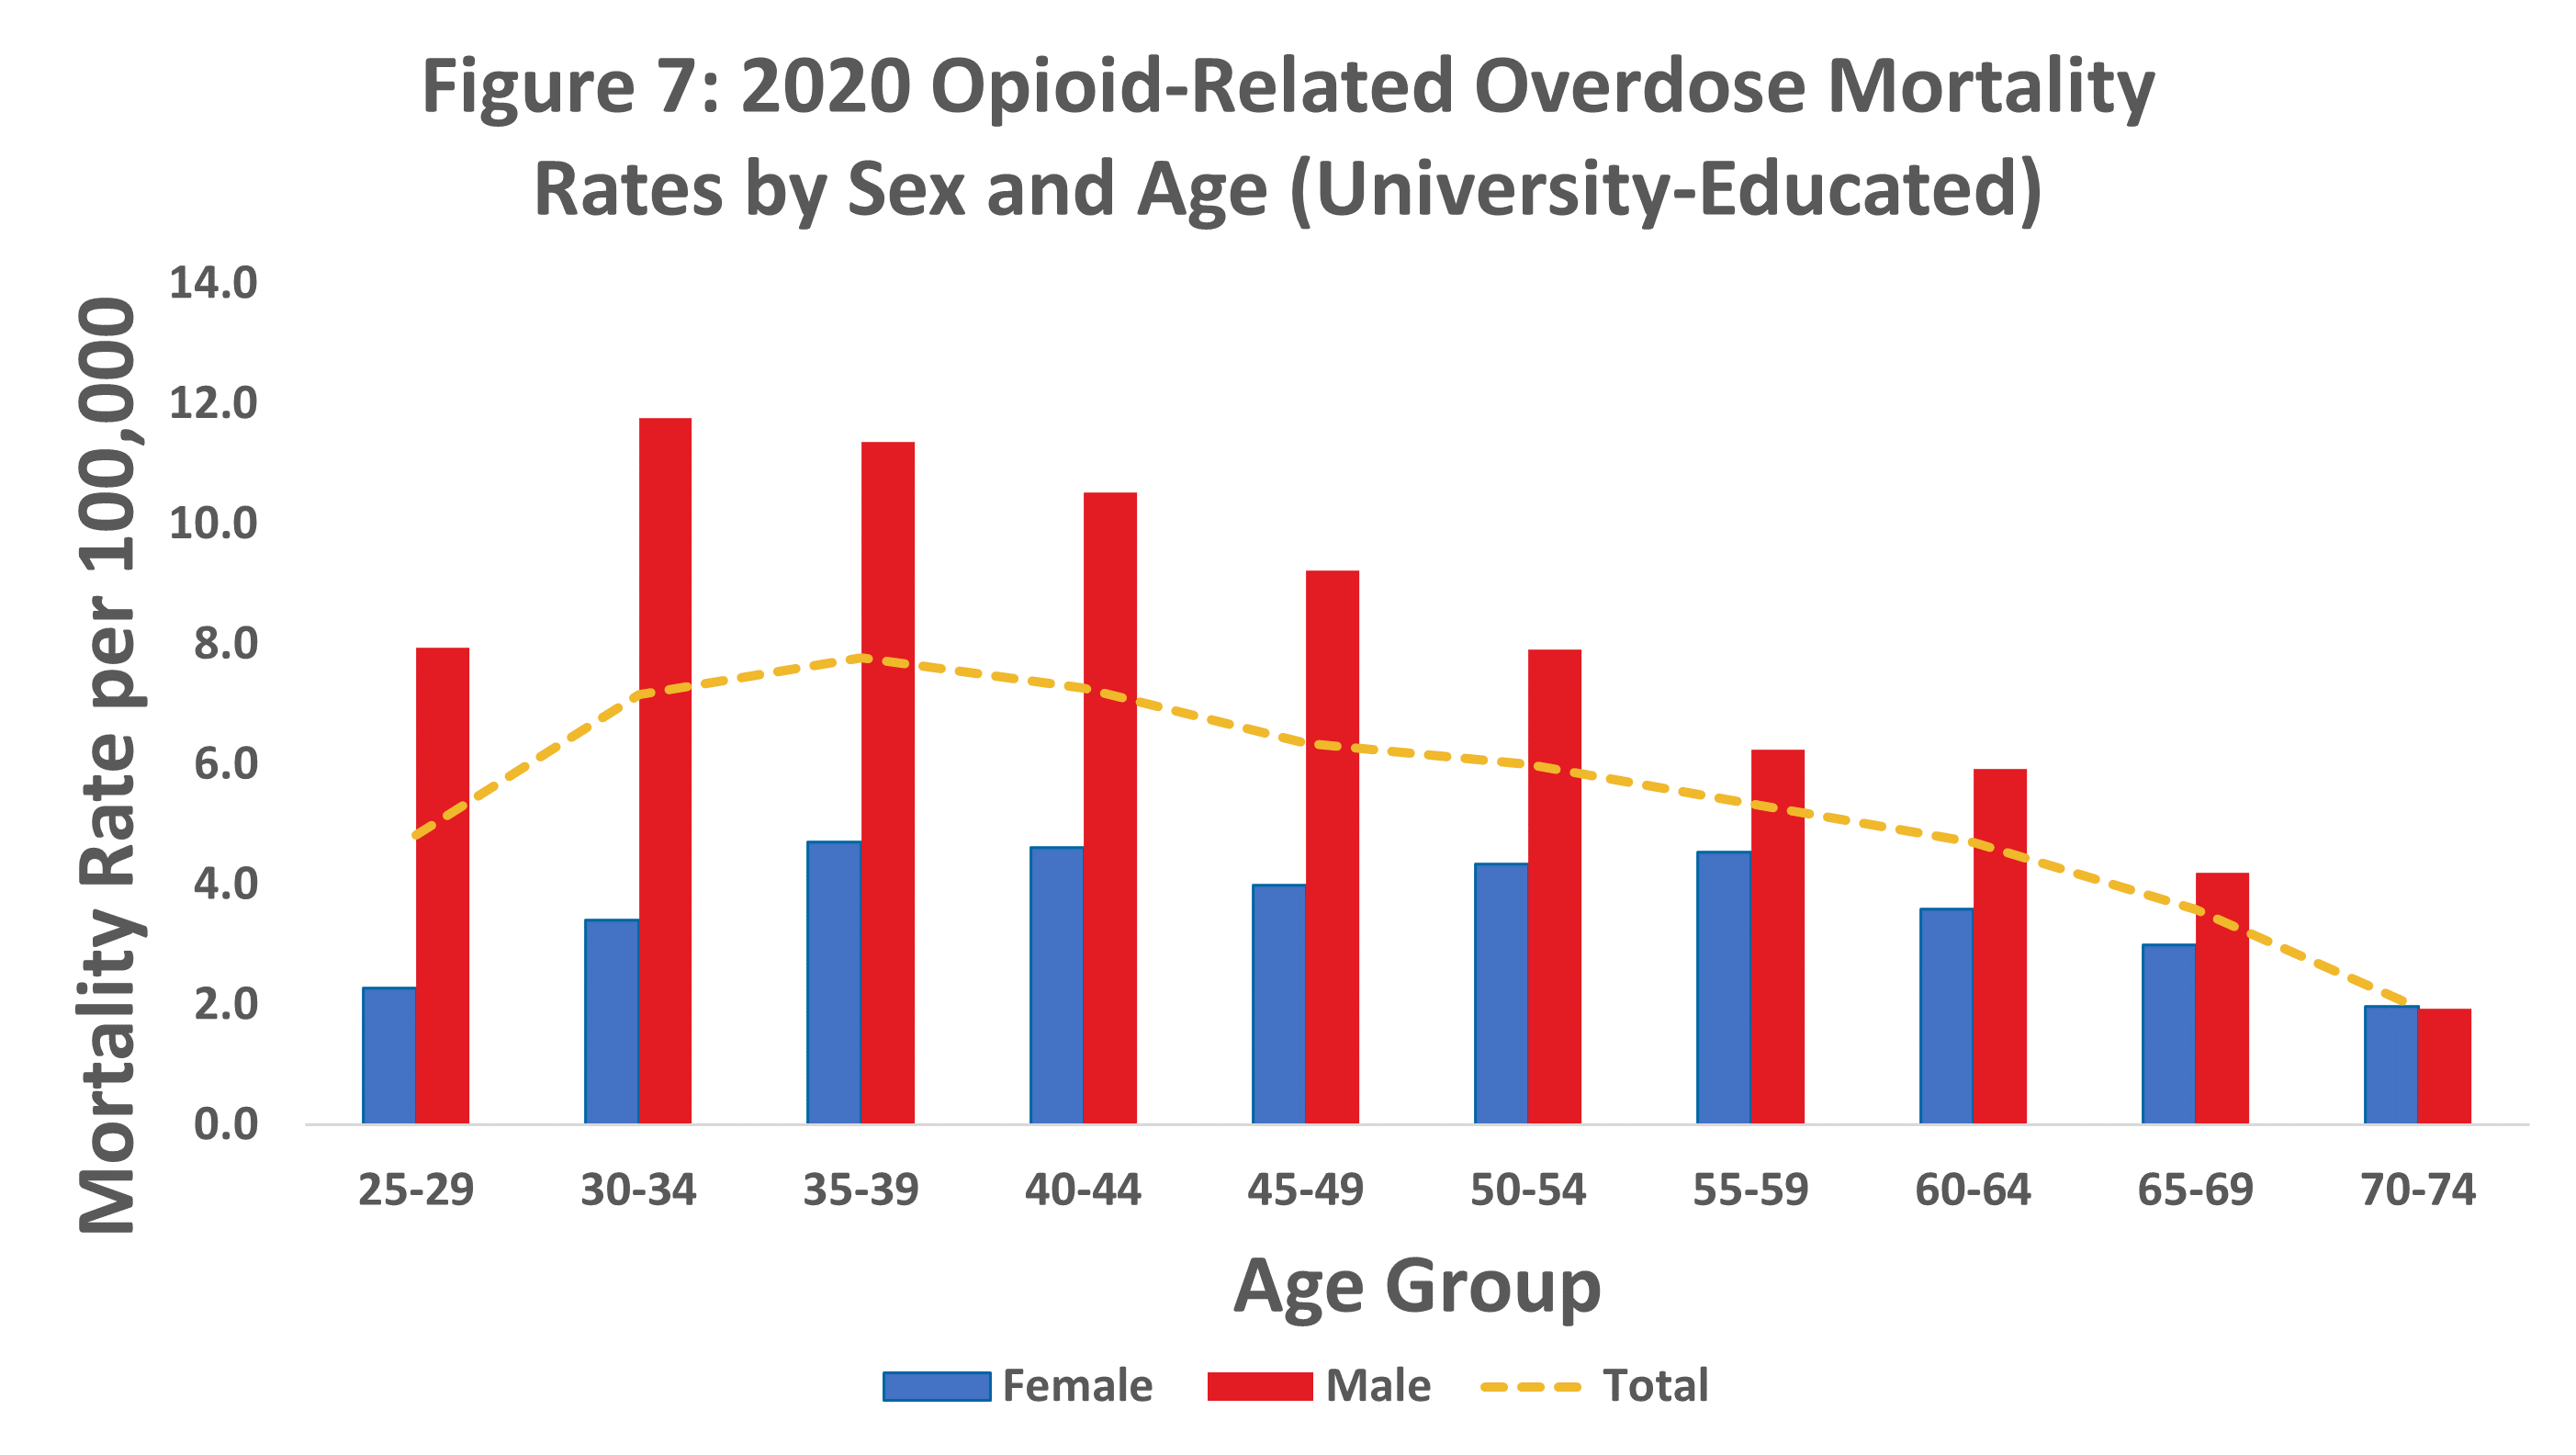
Males generally present a much higher opioid-related mortality rate than females.
Opioid-related mortality rates are about 2.2 times higher for males than females. The difference by sex peaks at age group 30 through 34 and then narrows with age.
Source: RGA analysis of mortality data from the MCOD and population data from the U.S. Census Bureau.
Chart note: University-educated in this analysis consists of United States civilian non-institutionalized population with bachelor’s, master’s, professional, and doctorate degrees. Excludes associate, vocational, and occupational degrees.
Opioid overdose rates also differ by marital status and occupation.
Never-married individuals have disproportionately higher opioid-related mortality than individuals who have married before.
People who have never married generally have 4-5 times the opioid mortality rates of their once-married counterparts. 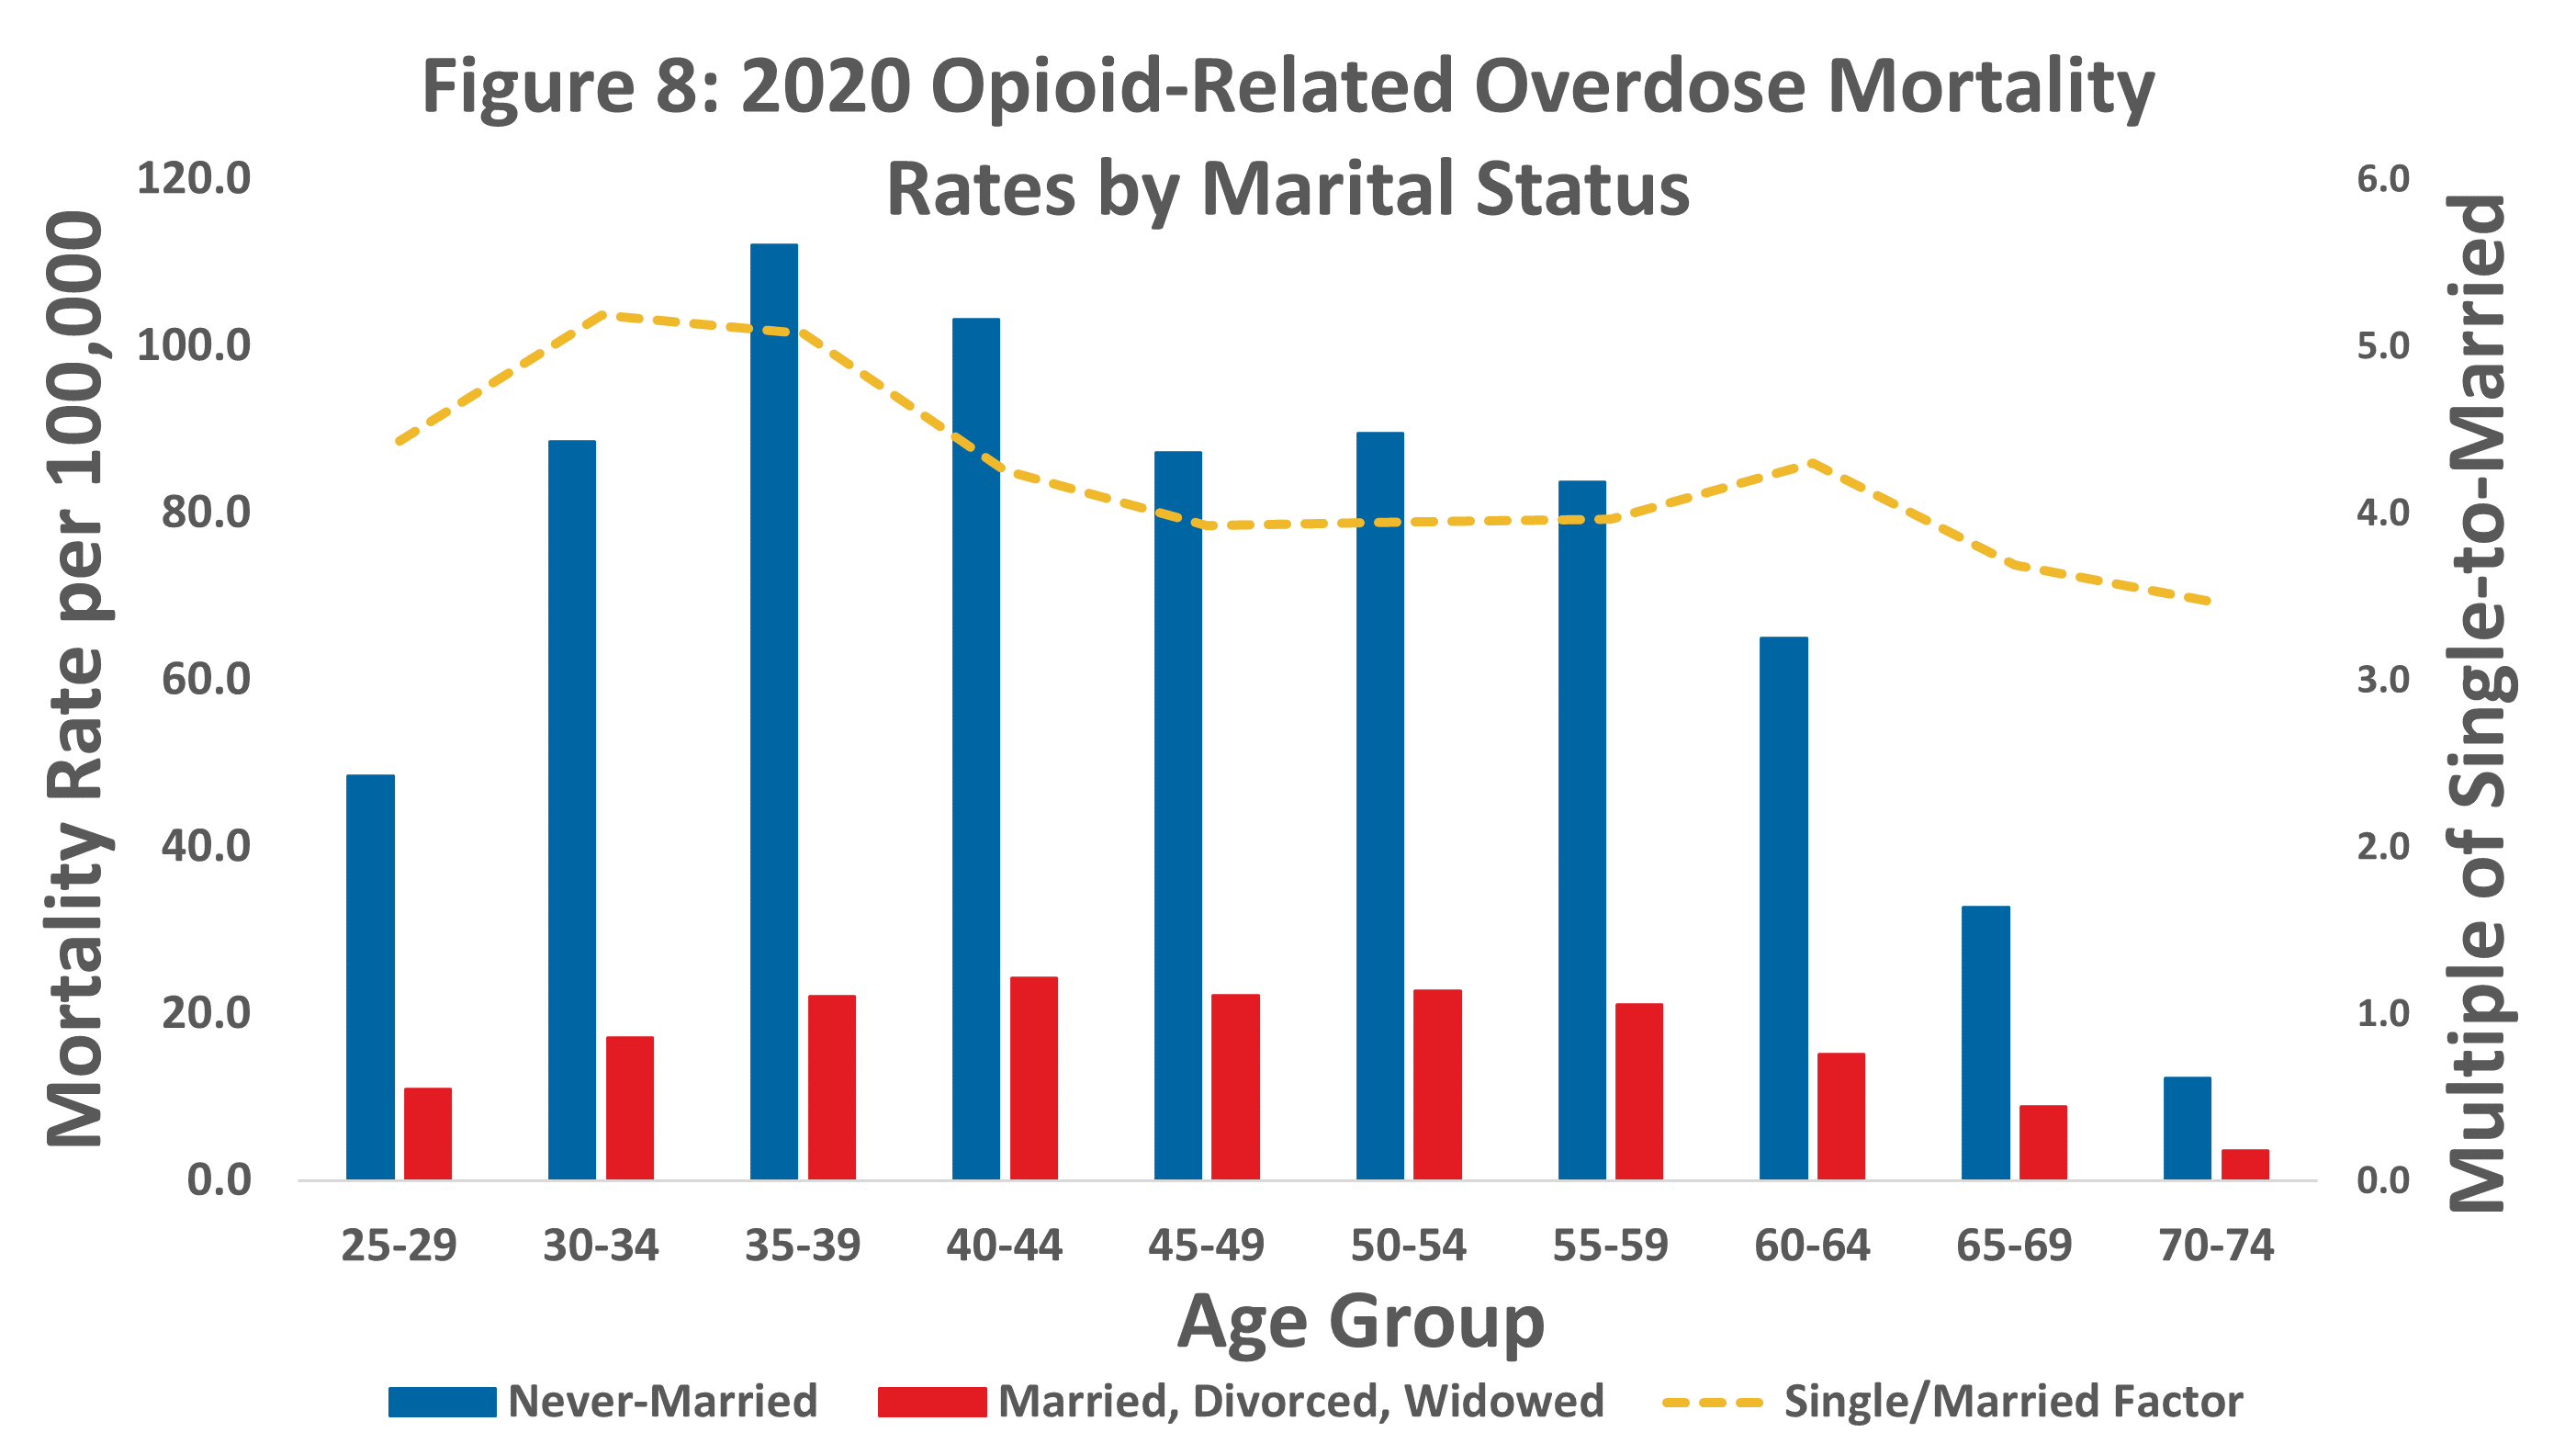
Source: RGA analysis of mortality data from the MCOD and population data from the U.S. Census Bureau.
Chart note: The most recent year of population data available at the time of analysis was 2019.
People with construction-related jobs have an opioid-related mortality rate eight times higher than the rate of those with business/science-related jobs.
While accounting for only about 9% of the workforce, construction-related professionals made up nearly 29% of opioid-related deaths. This represents the highest opioid-related mortality rate out of the five main occupation types defined by the U.S. Census Bureau.
People working in business/science-related occupations had the lowest opioid-related mortality rate. Production-related and service-related workers presented significantly higher mortality rates than people employed in business/science-related jobs. 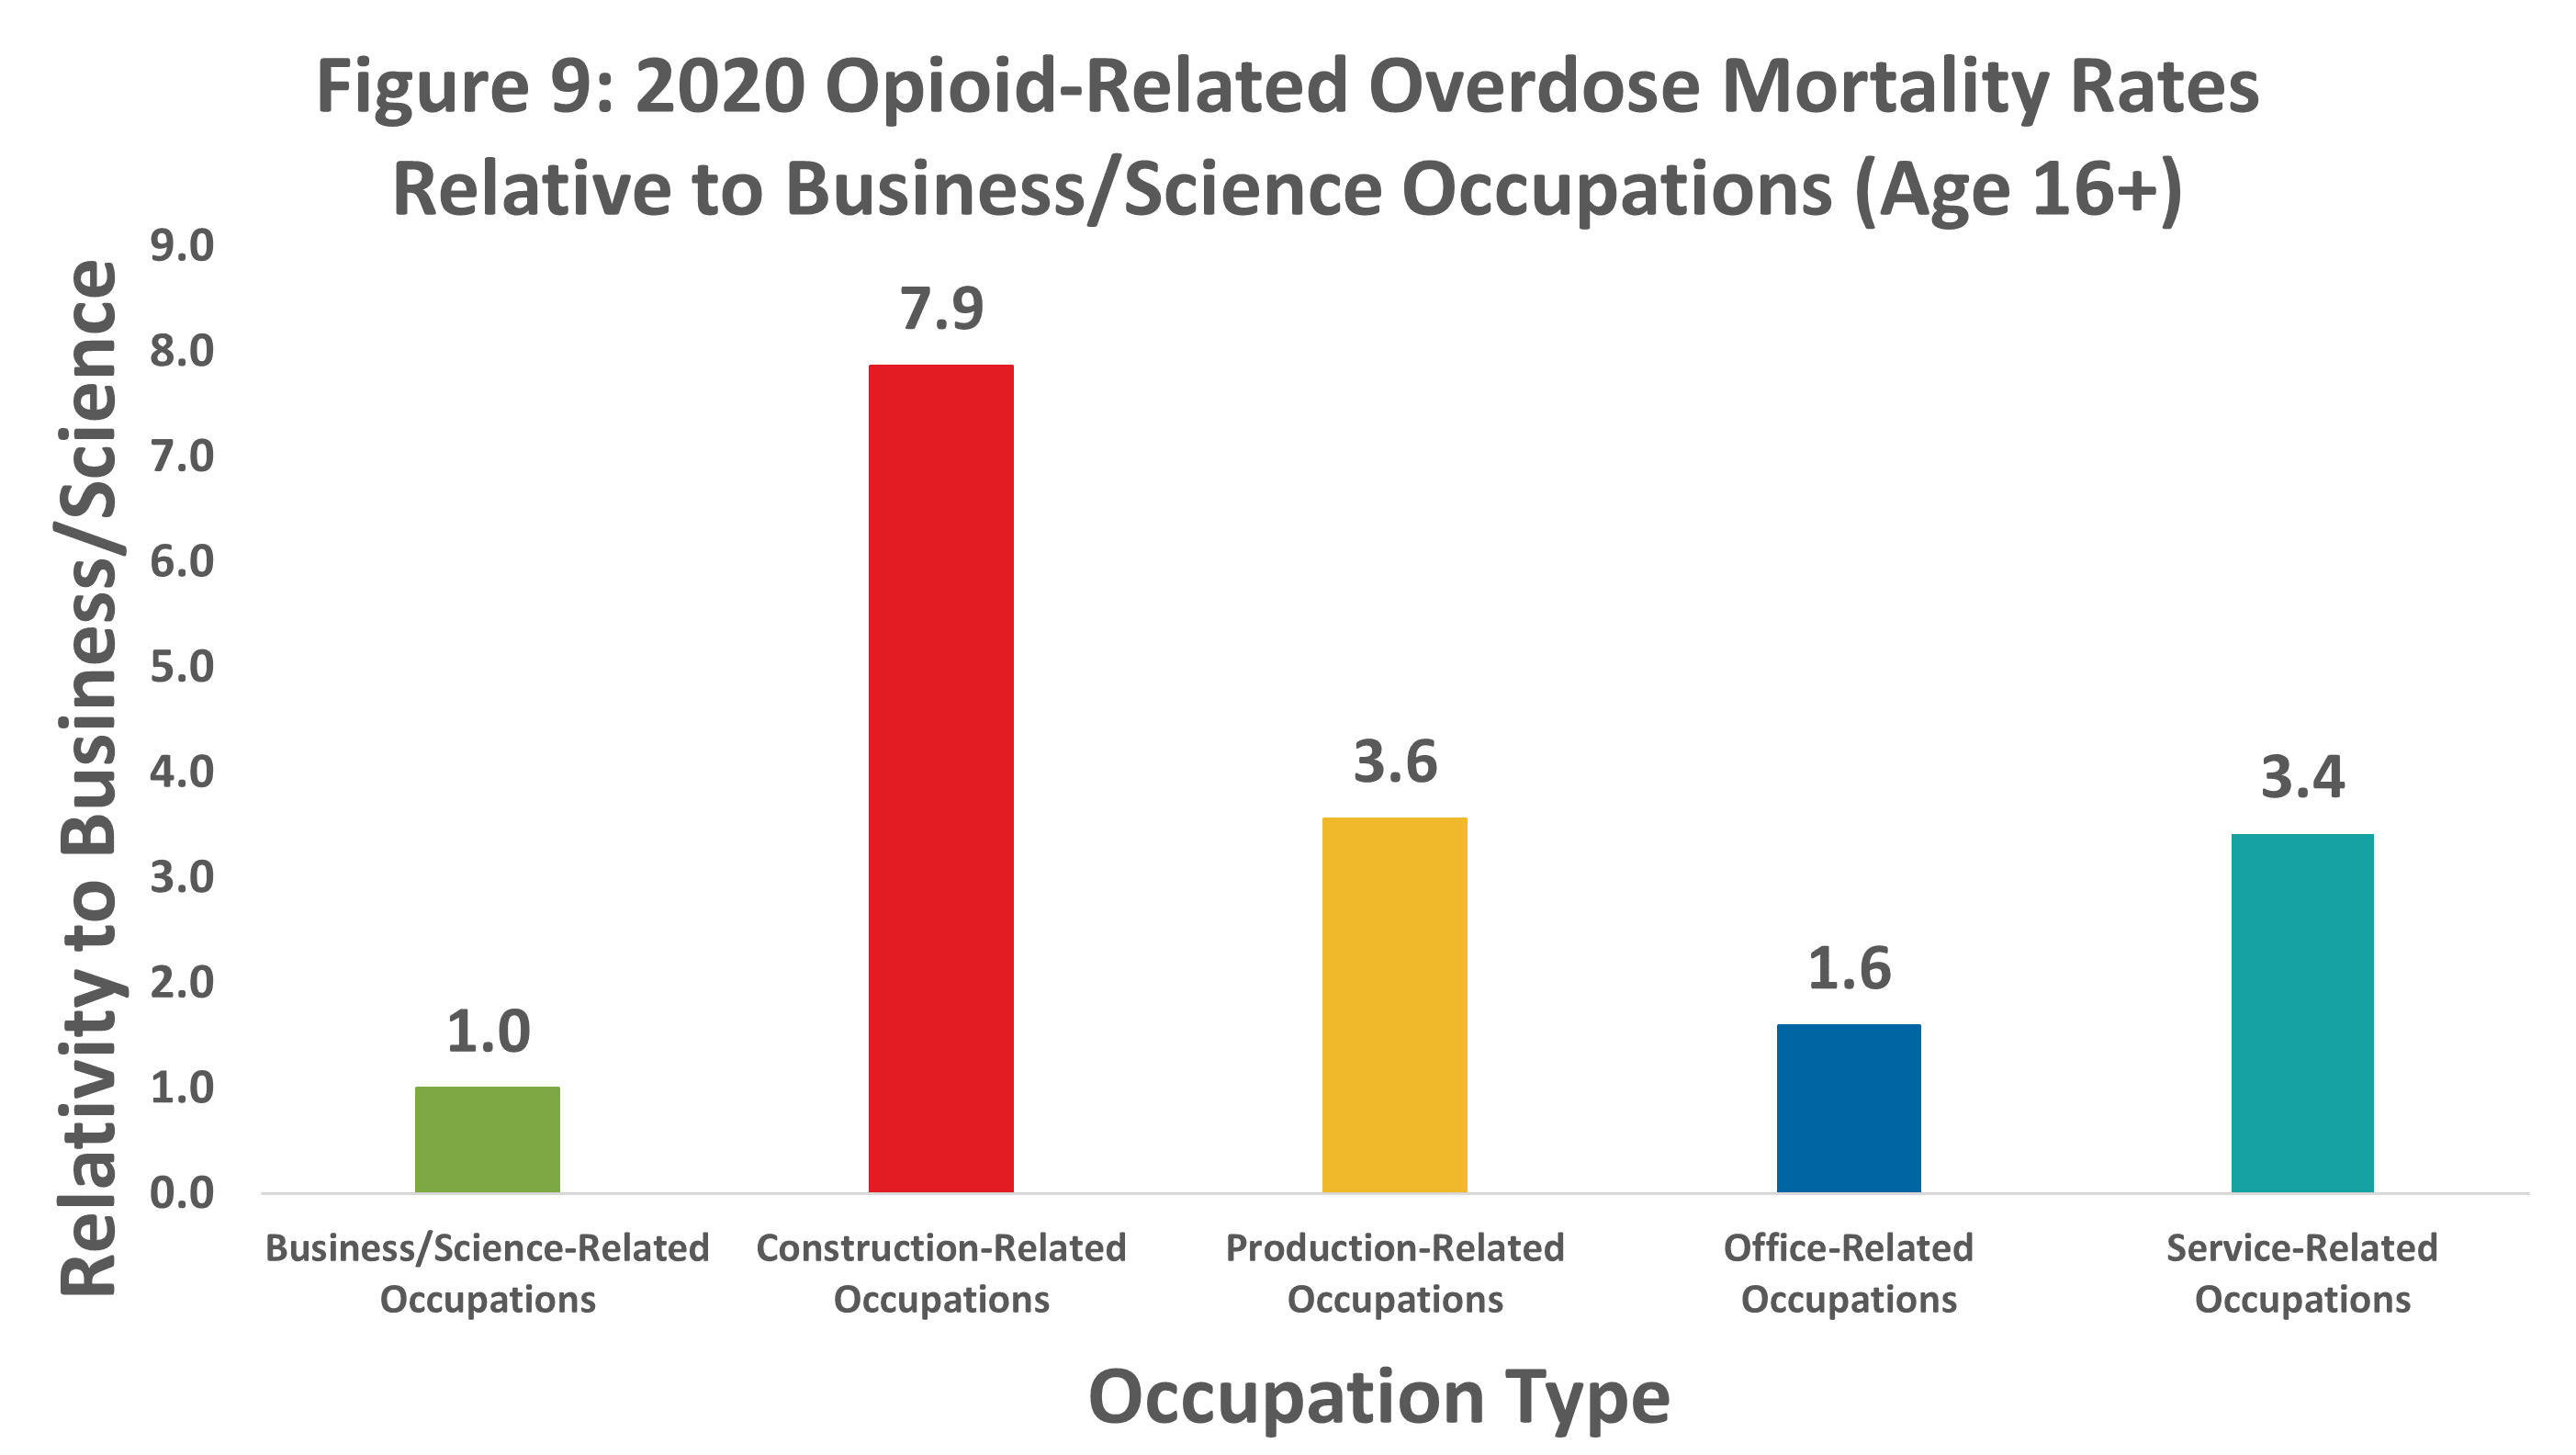
Source: RGA analysis of mortality data from the MCOD and population data from the U.S. Census Bureau.
Chart note: The most recent year of population data available at the time of analysis was 2018. Due to limitations in the population dataset, this analysis was based on civilians who were ages 16+.
Chart note: Occupation Types
- Business/science-related jobs include management, business, science, and arts occupations.
- Construction-related jobs include natural resource, construction, and maintenance occupations.
- Production-related jobs include production, transportation, and material moving occupations.
- Office-related jobs include sales and office occupations.
- Service-related jobs include service occupations.
Summary
Historical increases in opioid-related mortality began to subside in 2018-2019 but increased significantly in 2020. The peak of the 2020 increase occurred in May, coinciding with social isolation measures early in the COVID-19 pandemic. Individuals with lower educational attainment levels exhibited the largest increases in opioid-related overdose mortality. Overdoses involving fentanyl and synthetic opioids continued to rise, while other opioid-related overdoses remained constant or decreased. Age, sex, marital status, and occupation are key factors that influence opioid-related mortality experience. Opioid misuse continues to affect Americans of all demographic backgrounds, though individuals from the older, more educated demographics traditionally covered by life insurers have comparably lower risk.