Prescription histories have long served as valuable evidence for assessing the mortality risk of insurance applicants.
The introduction of electronic prescription histories now enables this information to be accessed in a more structured, verifiable, and cost-effective manner.
This article presents the mortality experience from a large block of insurance applicants for whom prescription drug histories were obtained at the time of application. Mortality differentials by drug severity classification and fill frequency provide key insights into the promise this tool offers for life insurance risk assessment.
Methods and Data
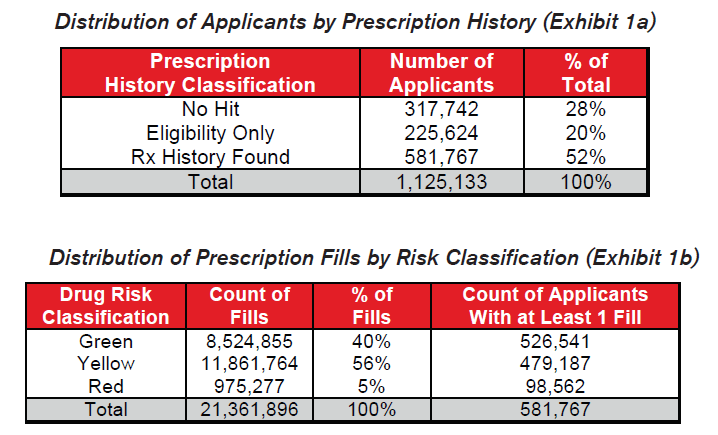
Milliman IntelliScript, a leading provider of prescription histories to the insurance industry, provided the data used for this mortality research study. For its IntelliScript product, Milliman gathers prescription histories on insurance applicants who have authorized the release of their records. A network of pharmacy benefit management companies is queried electronically and the results for the applicant are returned to the insurance carrier. The query may not find all of an individual’s prescriptions; however, for this study, some prescription information was known on over 70% of the applicants. The study data included information on 1.1 million applicants who had applied for insurance from 2005-2007. Over 21 million distinct prescription fills were included among these applicants.
Each applicant was matched by Social Security Number and validated by last name and birth date to the Social Security Administration’s March 2008 Death Master File (SDMF) to identify applicants who had died during the study period 2005-2007. Actuarial exposure by count was calculated for each applicant within each calendar year in the study period. Seriatim tabular mortality and actual-to-tabular ratios were calculated from the 2001 VBT Mortality table ultimate rates. Information on tobacco usage was not available. Relative mortality ratios were calculated by dividing the actual-to-tabular ratio for each category by the grand total actual-to-tabular ratio. The graphs throughout this document display these relative mortality ratios bounded by approximate 95% confidence intervals based on the number of deaths.
As a validation and alternate method of analysis, randomized control groups were generated and compared to the cohort of deceased applicants. The ratios of these distributions provide insights into the relative mortality differentials by prescription history classification similar to the mortality study analysis.
Drug Risk Hierarchy
Milliman IntelliScript has developed a “Green/Yellow/Red” drug risk hierarchy as a qualitative tool for assessing the relative mortality risk of likely conditions indicated by each drug. This hierarchy has been modified slightly for the purpose of this study based on input from RGA underwriters and medical staff, primarily to reduce the number of drugs classified as Red. Both the hierarchy developed by Milliman and the modifications made by RGA were performed separate from and without advance knowledge of the results from this mortality study. The G/Y/R drug risk classifications within the hierarchy are based solely on the generic drug name and, therefore, do not vary by gender, age, or dosage.
Mortality Study Results
Results are aggregated based on the prescription history information available for each applicant at the time of his or her original application.
- Applicants found in the prescription history query with no prescription fills are classified as “Eligibility Only.”
- Applicants not found in the prescription history query are classified as “No Hit.”
For applicants for whom prescription histories were found,
- If only Green drugs were found, indicating likely low mortality risk conditions, the applicant is classified as “Green Only.”
- If Yellow drugs but no Red drugs were found, indicating likely moderate mortality risk conditions, the applicant is classified as “Yellow, no Red.”
- If any Red drugs were found, indicating likely high mortality risk conditions, the applicant is classified as “Red.”
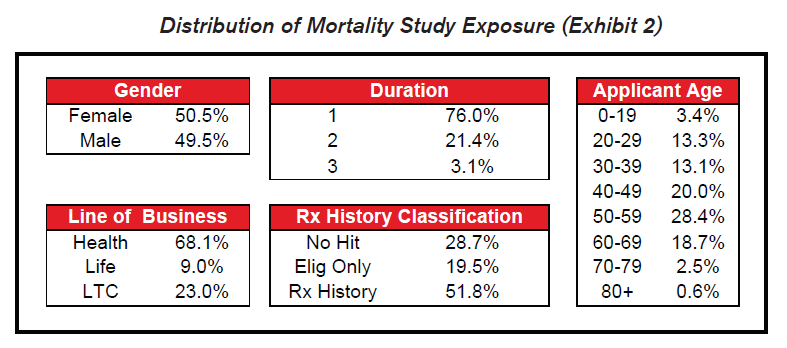
Most of the exposure in the study covers health or long term care insurance within the first two years of their application.
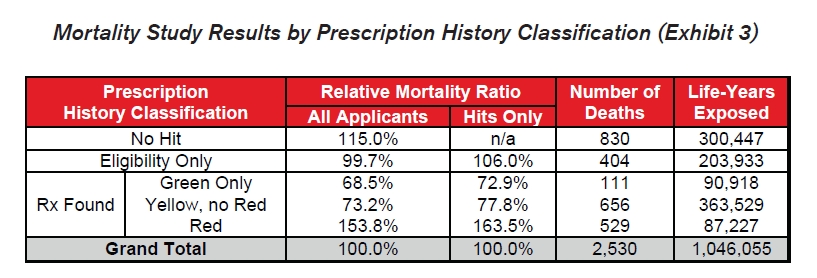
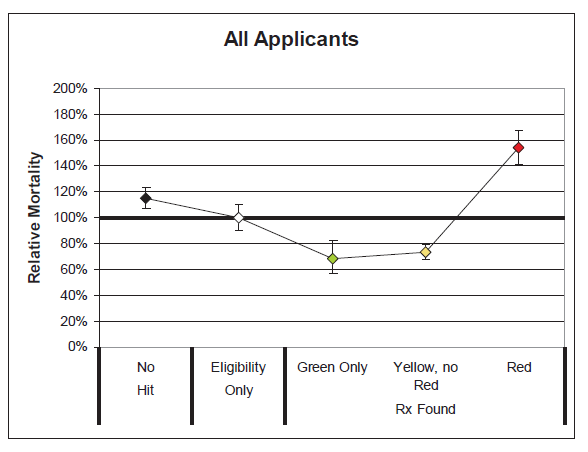
Several key takeaways are clear from these results:
- The differentials in relative mortality risk between the various drug risk hierarchy classifications demonstrate the strong predictive power of a given applicant’s prescription drug history on his or her mortality risk.
- Mortality is substantially higher among those applicants who were prescribed Red drugs. These drugs are more commonly indicative of high mortality impairments.
- Mortality for the “No Hit” cohort is slightly higher than average.
- Mortality of those prescribed Green or Yellow drugs without Red drugs is substantially better than average, even when compared to those in the “Eligibility Only” group for whom no drugs were found. This could be an indication that the Green and Yellow drug cohorts are more vigilant in getting routine check-ups and that the drugs which are prescribed are serving their intended purpose of curing diseases or maintaining health. Conversely, while a portion of the “Eligibility Only” group is likely to be very healthy, an unhealthy cohort of individuals may exist within this group who do not regularly visit the doctor and may not realize they need to be on Red drugs.
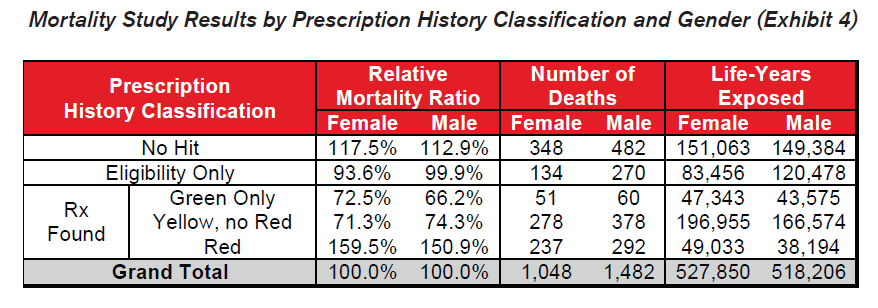
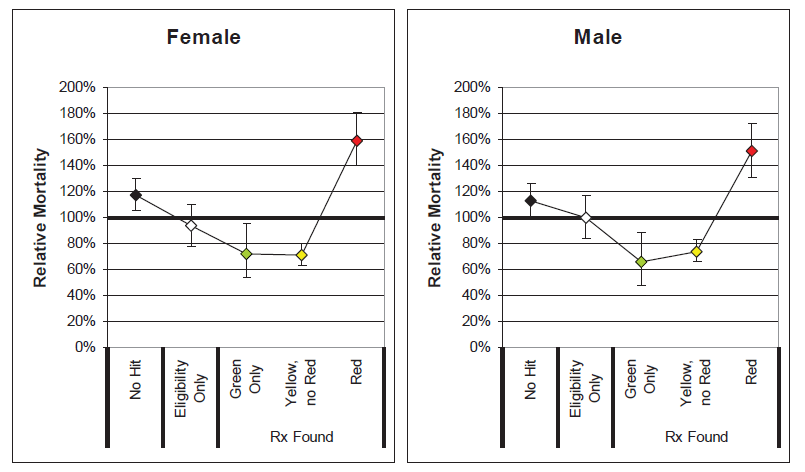
- The general relationship among the drug risk classifications is similar for males and females. This indicates that electronic prescription histories may be a useful screening tool for underwriting both genders.
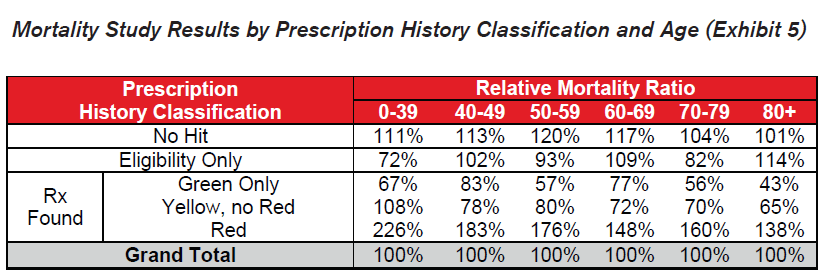
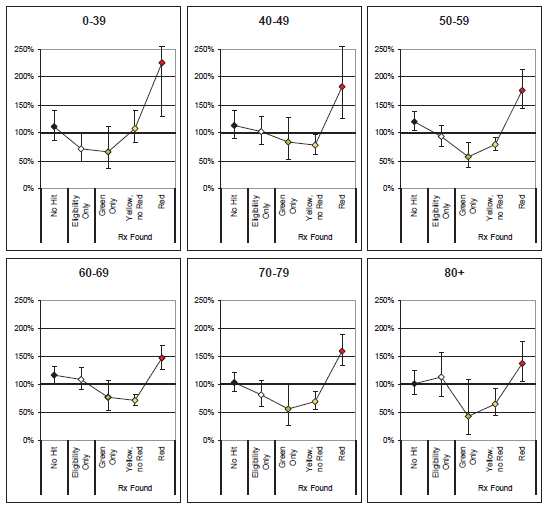
- Similar patterns emerge across all ages by prescription history classification. Slight anomalies are likely due to random fluctuation or limited credibility.
- Red drugs prescribed to younger applicants seem to indicate higher relative excess mortality than for older applicants. Younger applicants on Red drugs are less common and the presence of these drugs may be more indicative of a serious condition.
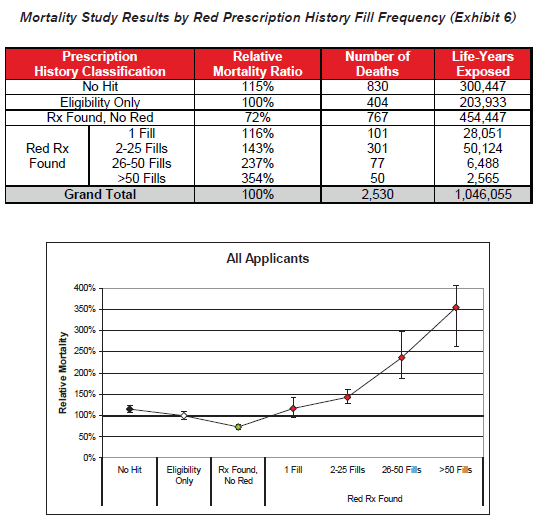
- Fill frequency is also an independently important predictor of excess mortality within the high-risk drug category. Higher fill frequencies are possibly indicative of chronic conditions or of conditions that are not responding well to other treatments.
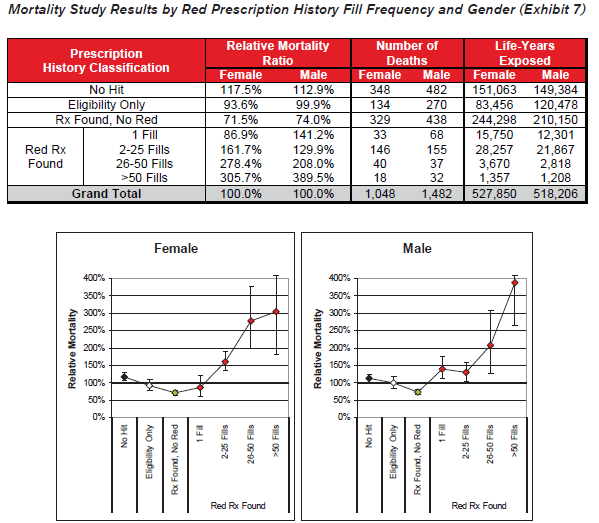
- Red drug fill frequency is a relevant mortality risk predictor for both male and female applicants.
Randomized Control Group Results
To validate the general findings of the actuarial mortality study, an alternate analysis was performed using randomized control groups. This simple method compares the distributions within each prescription history risk classification between the group of applicants who died and five randomly generated control groups of applicants who did not die. The control groups were selected by randomly choosing a non-deceased applicant from the data that exactly matches the year of birth, gender, application year, and line of business for each of the deaths in the study period. This method controls for known mortality risk characteristics without requiring debate about the appropriateness of a given mortality table.
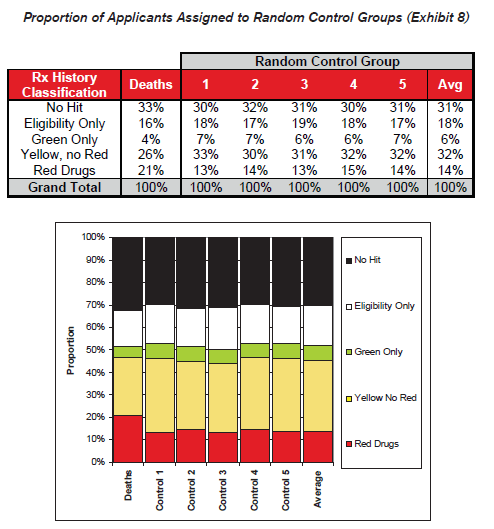
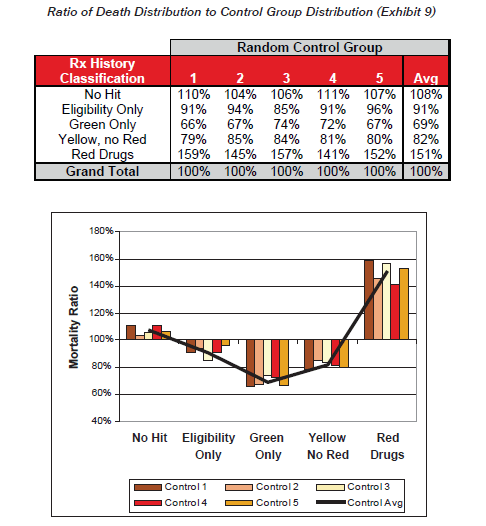
Exhibit 9 shows the ratio of distribution of the cohort of deaths to the distribution of the control groups, which gives an indication of the comparative likelihood of death for each classification. These ratios are intuitively similar to the relative mortality ratios presented earlier.
Protective Value
The potential mortality savings from a new piece of underwriting evidence can be calculated as the present value of excess mortality for those applicants whom the test accurately and uniquely identifies the impairment. Positive protective value is provided when the mortality savings exceeds the cost of implementing the test.
For prescription history queries, an expense is only incurred when a hit is returned. In these cases, a simple model can be developed by comparing the excess mortality attributable to applicants prescribed Red drugs to those who have not been prescribed Red drugs. Among the cohort of Hits, the applicants with Red drugs have a relative mortality ratio of 163.5% compared to 85.1% for those without Red drugs. A 10-year actuarial present value model was created using a 6% discount rate, 6% annual lapse rate, and age and gender specific mortality differentials relative to 100% of the 2001 VBT S&U table. This model shows that the actuarial present value of benefits for applicants with Red drugs is $34.30 per $1,000 and the PV of benefits for applicants without Red drugs is $17.40 per $1,000. The potential excess mortality savings is therefore approximately $16.90 per $1,000 of face amount issued.
The potential mortality savings should be reduced by the prevalence of applicants with Red drugs, which is 11.7% of hits based on the mortality study exposure, and by an “exclusivity” factor representing the degree to which the test is the only source of available evidence to identify the impairments generating excess mortality. The average expected mortality savings for a block of $250,000 policies would then be $250.00 * $16.90 * 0.117 * Exclusivity = $495.00 * Exclusivity. If the prescription history information was 100% exclusive, the average mortality savings on a $250,000 policy would be $495.00, or 11.4% of expected Non-Red mortality.
For the prescription histories to provide positive protective value to the underwriting process, the mortality savings must exceed the cost of the test. While the cost of the service will vary, the required exclusivity of a $12 test would be $12 / $495 = 2.4%. In other words, the prescription history must be the exclusive source identifying a high risk impairment just once out of every 41 times the prescription history returns Red drugs. While each company’s target markets, underwriting procedures, and prescription drug hierarchy definitions will lead to different results, it seems very likely that a strong case can be made for using prescription histories even in a fully underwritten environment.
Since the cost of the service does not vary by policy size or issue age, the exclusivity required for positive protective value is higher for policies issued at younger ages and smaller face amounts. Given that less evidence is typically collected for these policies, the exclusivity should naturally be higher. Conversely, although prescription history information for larger policies and older ages will be less exclusive due to the other information being collected, the potential mortality savings is much larger.
Sentinel Value
In addition to the protective value that prescription histories provide by uniquely uncovering impairments generating excess mortality during the underwriting process, they might also provide some sentinel value by deterring applicants who may otherwise seek to fraudulently omit relevant medical information. For the roughly 70% of Hits, the prescription history information may be used directly to inform an underwriting decision (in combination with the applicant’s medical disclosures.) For the 30% of No Hits, however, the underwriter must make an assessment based only upon application disclosures or other routinely collected evidence. Applicants who knowingly choose to be dishonest on their applications could potentially go undetected. If applicants have advance knowledge that prescription histories will be verified, however, they will have less incentive to be dishonest on their application since they have no way of knowing whether they will fall into the group of Hits or No Hits. This should lead applicants with Red drugs to either provide an honest assessment of their medical history or apply for coverage with another company. As a result, similar mortality savings might be obtained from applicants with Red drugs regardless of whether their prescription query returns a Hit or No Hit.
Conclusions
It has been clearly demonstrated that drug risk hierarchies can be developed to stratify the relative mortality risk of applicants at the time of underwriting and that the relative mortality among those taking the highest risk drugs is significantly higher than average. It has also been shown that eligible applicants with no history of filling prescriptions have worse mortality than those who have filled lower risk prescriptions, suggesting the value of regular medical screening and maintenance drugs. Mortality differentials by drug history classification are persistent for both genders across all ages. Finally, based on the results of this mortality study, prescription drug histories are likely to have positive protective value for life insurance underwriting.
Limitations and Areas for Future Study
The following items could aid in a deeper understanding of the value of electronic prescription histories for life insurance underwriting:
- The data analyzed was primarily business applied for in the past 1-2 years. Questions remain regarding later duration mortality, including the length and steepness of corresponding mortality select factors.
- Further analysis could be performed on fully underwritten life insurance applicants as the data becomes available.
- Concurrent or parallel underwriting studies could provide more insights into the exclusivity of information obtained from prescription histories as compared to other sources, such as the application, tele-interview, or APS.
- The impact of dosage and strength information from a pharmacy record may be studied to determine their predictive value.
- Prescription compliance among those in need of maintenance drugs for a chronic condition could be tested based on the history of fills.
- The smoking status of applicants was not available in the data provided by Milliman IntelliScript. It is quite likely that this is a confounding variable and that some portion of extra mortality attributable to Red drugs will be captured using smoker distinct mortality expectations.
- Other variables may also be correlated with Red drug usage such as build and family history. To the extent that such information is available at the time of underwriting, the exclusivity of the prescription history information is reduced.
- Where credible, mortality could be studied for specific drugs or drug classes. Groups of drugs by likely disease indication could also be studied for specific drugs, drug classes, or drugs prescribed in combination.
It should be reinforced that information obtained from an electronic prescription history will never be a substitute for the expertise of medical underwriters. There will be cases where drugs commonly associated with a specific impairment were in fact intended to treat a completely different benign disease. Automated indications of an applicant’s likely risk based on a prescription history must be combined with the expertise of trained underwriters to develop a complete risk profile.