Responsibility
  • Research and White Papers
  • February 2024
  • 6 minutes

Impact of Anti-Selective Behavior on the Life Insurance Industry

By
  • Julianne Callaway
  • Leigh Allen
  • Colin M. DeForge
  • Kaitlyn Fleigle
Skip to Authors and Experts
Golden Gate Bridge disappearing into the fog
In Brief
An RGA analysis of policy-level data derived from an unprecedented, collaborative database and augmented by input from industry experts provides greater insight into the impact of anti-selection on the life insurance industry and potential ways to prevent it.

Introduction

Fraud, misrepresentation, and anti-selection pose a significant financial burden to the insurance industry, leading to annual losses in the hundreds of billions of dollars across all sectors; the life insurance industry is hardest hit, experiencing an estimated $75 billion loss annually. As a result, insurance companies charge higher premiums to mitigate the financial impact. Additionally, an internal RGA analysis found that most life insurers rescissions occur during the contestability period, typically within the first two years of issuing the policy. If rescissions begin to erode consumers’ trust that death claims will be paid, the cost of fraud and misrepresentation could extend beyond financial repercussions. 

While anti-selection is clearly a significant issue for the industry, determining the full extent and total cost of specific anti-selective behaviors remains a challenge. Developing a better understanding of this issue can empower companies to improve the insurance buying process and provide affordable life insurance coverage to the many people who need it.

To better understand the impact of anti-selective policyholder behavior on the life insurance industry, RGA partnered with MIB to analyze anonymized data from a contributory industry database, known as the MIB Data Vault. The analysis was further informed by a series of expert interviews with leaders at seven life insurers, who provided insights into two types of anti-selective behavior specifically: churning and stacking. 

This report also leverages an industry study of insurance fraud conducted by RGA in 2016-2017 to provide historical context and guide the design of the current analysis.   

Background

In determining impact, it is important to first understand the scope of “fraud” from an insurance perspective. Stacking may be used legitimately to help diversify coverage, and churning policies may occur when product performance better suits an owner/applicant. However, anti-selective behaviors – such as material misrepresentations related to stacking, and churning motivated by agent commissions and intentional omissions  are harmful to both insurers and consumers.  

Though novel means and techniques to commit insurance fraud continue to emerge, the issue of fraud in insurance is not a new one. In a poll conducted during the annual RGA Fraud Conference in 2016, one-third of attendees indicated fraud limited the number or face amount of simplified issue (SI) policies that their companies were willing to write. That same year, RGA conducted a wider survey of insurers to better understand the impact of fraud on the industry. In that survey, insurers also indicated a need for digital tools to help identify or flag problems.

Relevant findings from the 2016 fraud study:

Research approach

While many of the findings of our 2016 fraud study remain relevant today, life insurance underwriting has advanced materially since then, and the ability to engage in fraudulent and anti-selective behavior has advanced along with it. As described in the article, “Accelerated Underwriting: Maximizing its Future,” insurers employ accelerated underwriting much more today than a decade ago. Advances in technology and data analytics – an evolution further driven by the in-person challenges of the COVID-19 pandemic – have resulted in a more modernized and digitized life underwriting landscape. 

A recent industry collaboration aims to help insurers navigate this daunting landscape and more easily identify instances of anti-selective behavior. TAI, the market leader in reinsurance software and consulting services, teamed up with MIB, an industry leader in data insights and digital solutions for risk assessment, to create an unprecedented in-force and terminated policy dataset to serve the U.S. and Canadian insurance industry. This dataset is known as the MIB Data Vault. TAI administers about 75% of reinsured in-force business in the U.S. Meanwhile, MIB’s Insurance Activity Index screens nearly 100% of pending applications in the U.S. and Canada. Combining in-force and pending coverage data provides a more comprehensive picture of total coverage exposure. Learn more about this collaboration and its potential in this article: “Collaborative Database Delivers Tool to Detect Life Insurance Fraud Before It Happens.” 

RGA studied anonymized data1 from the MIB Data Vault with data contributed by 10 insurers as of January 2024 to better understand the anti-selective behaviors of churning, and stacking. 

  • Churning – Replacing an existing policy with a new policy2 for the purpose of generating additional commission revenue. This can impact insurer profits and primarily relates to agent behavior.
  • Stacking – A policyholder owning multiple policies to increase the amount of coverage with a lower level of underwriting scrutiny than if a single large policy had been purchased. The effect of this behavior is higher claim amounts than an insurer would expect to experience if the policy was underwritten for the full amount, thus increasing costs to consumers and limiting an insurer’s ability to promote faster-issue policies.

Analysis methodology

Churning flags were identified when:Stacking flags were identified when:
  • any policy lapsed or terminated for unknown causes within 1-4 years of issue date, and
  • a new policy was issued at a different carrier within two months of that lapse/termination.
  • one individual owned three or more policies that were issued within one year,
  • each policy had up to $1 million face amount value,3
  • the policies were issued from at least three different carriers, and
  • earlier-issued policies did not terminate within one year of the newly issued policy.
In our sample, 7,560 policies from 7,500 individuals were flagged as potential churning cases, accounting for approximately $7.5 billion in face amount, of which $5.6 billion was retained by the carriers.Using this definition, 6,061 policies from 2,035 individuals were identified as potential stacking cases. This represents approximately $1.7 billion in face amount with $1.3 billion retained across the 10 carriers in the data.

These figures, of course, do not capture the total impact of churning and stacking. The database includes only data contributed at the point the study was performed, and the data analysis misses flagging individuals who exhibit potential churning or stacking activity involving companies outside of this dataset. Thus, the prevalence of churning and stacking in this analysis can be considered to be a minimum threshold.

Venn Diagram for Anti-Selection Database


It is also important to note that any extrapolation of this data assumes the experience of the contributing companies is representative of the industry as a whole. The ability to analyze agent and applicant behavior will improve over time with additional policy-level data.

With the data available, our analysis was able to derive key insights from the potential churning and stacking cases identified. To further inform the analysis, RGA interviewed seven insurance industry experts to gather current views on the challenges anti-selective behaviors pose to the industry. These experts came from companies represented in the database as well as companies not represented. Additionally, the companies employed wide-ranging distribution models and offered diverse product portfolios. 

Key findings

Level of concern

During our interviews, insurers were asked about their level of concern with churning and stacking and whether this concern had changed over time. Their responses were enlightening. 

For example, churning and stacking are of greater concern for insurers writing policies with small to mid-level face amounts than for those focused on policies for high net worth individuals. In addition, as long-established agents retire, and a younger generation takes over, insurers are concerned this may increase churning if the new generation is less familiar with or has lower regard for established norms for ethical business practices. 

Overall, our interview findings revealed that insurer concern with anti-selection has increased in the last 10 years. Interviewees acknowledged that anti-selection is increasingly difficult to identify and will likely continue to grow alongside automation.

Impact of accelerated underwriting

Our interviews confirmed that the increased use of accelerated underwriting in life insurance has changed the perceived challenges presented by churning and stacking. As companies become more comfortable with fluidless underwriting, insurers expect greater opportunity for anti-selective behavior to promote higher levels of misrepresentation among applicants. 

Faster decisions and ease of applications can also cause applicants to be less invested in the process. If they do not have to undergo exams or bloodwork, applicants may view the process as more ”switchable,” allowing them to easily apply to multiple companies for coverage. 

Distribution model

Insurers selling primarily through a captive sales force are generally less concerned with churning and stacking. Greater concern exists among insurers offering brokered sales and direct-to-consumer (D2C) products, especially if the underwriting is fluidless, where, in the words of one interviewee, it is easier for applicants to “sprinkle across the industry to see what they can get through.” Additionally, D2C online questions may not be perceived as ”real” to consumers, who also may not understand the implications of anti-selection on the industry and premium rates.

Churning and stacking experience by age

In our interviews, insurers expressed concern for stacking among different age groups for various reasons. For younger ages, digital medical evidence (e.g., prescription histories) used in accelerated underwriting may not be as rich as compared to older applicants. Furthermore, a higher level of comfort with technology coupled with increasing availability of D2C products that remove the agent altogether may create greater opportunities for misrepresentation. On the other hand, the prevalence of medical impairments increases with age, which provides added motivation for older applicants to acquire sufficient insurance coverage with reduced underwriting scrutiny. More medical impairments also means that a similar level of misrepresentation is more costly at older ages because it is acting on a larger base of impaired lives.

Using the MIB Data Vault, RGA reviewed the experience data by age for both stacking and churning flags, comparing each to the age distribution of the total policies in the dataset, represented by the gray line. For example, on a face amount basis, 34% of the policies with stacking flags are from people aged 50-59; however, only 18% of the full database is aged 50-59. The comparison of these distributions is represented by the stacking bar at 1.90 (calculated as 34%/18%) relative to the line at 1.00 (calculated as 18%/18%) for the full dataset. This analysis allows us to understand how age impacts the likelihood to churn or stack policies.

In this analysis, churning- and stacking-flagged experience exhibits different patterns by issue age. While experience for policies flagged as churning is rather consistent at all ages above 30, noticeable differences by age emerge for potential stacking. Individuals aged 40+ (especially 50-59) disproportionately trigger higher levels of stacking flags relative to the total policies issued within the dataset. 

Churning and stacking experience by face amount

Insurer expectations for churning and stacking experience by face amount was nuanced. Because applications with smaller face amounts are often automated or reviewed by junior underwriters, instances of churning and stacking were considered more likely to go unnoticed. Nevertheless, insurers also expected anti-selection to pose a problem at higher face amounts given the clear financial incentive.

RGA reviewed the experience data in the MIB Data Vault by face amount for both stacking and churning flags, comparing each to the distribution by face amount of the total policies in the dataset, represented by the “1.00” gray lines in the following graphs.

Flagged churning cases vs. the average

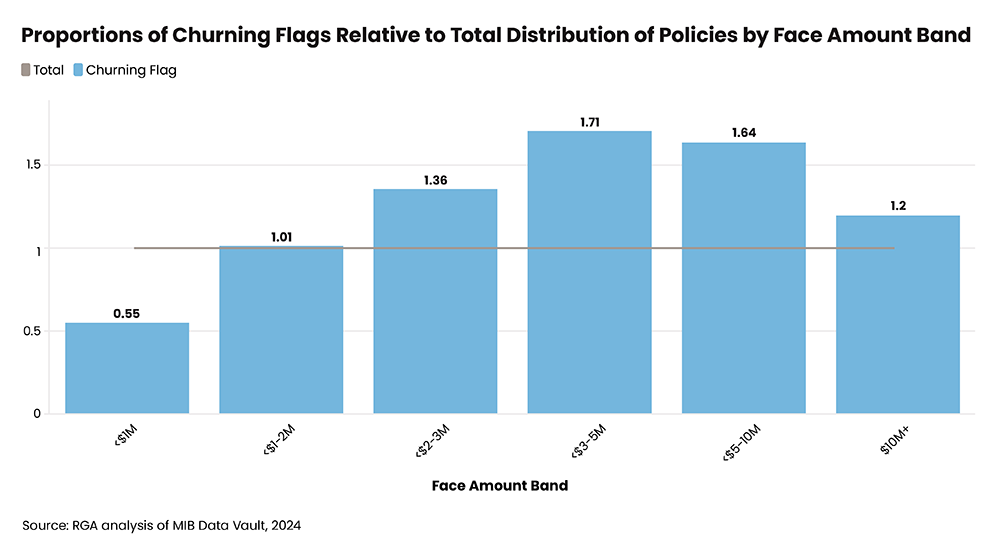
Policies with $2+ million in face amounts produced disproportionately higher levels of churning flags, with the $3-5 million band having the highest level. Since churning is linked to agent behavior, these results could be driven by higher commissions for agents at higher face amounts.

Studying the dataset for stacking flags by face amount, we found that policies with less than $500,000 in face value posed the largest risk of stacking concerns, which may be related to industry underwriting practices. According to the 2022 Accelerated Underwriting Practices Survey Report from the SOA, the most common maximum face amount for accelerated underwriting was $1 million. These amounts are even lower under guaranteed or simplified issue products.  

Technology and Tools

Technology and tools play an important role in both enabling and combatting anti-selection. Technology makes detection and prevention solutions possible for insurers but can also increase the potential for fraud and misrepresentation compared to the days of paper-driven reviews and decision making. Streamlined digital applications and underwriting processes can make it easier to get insurance coverage to people who need it, but such innovations may also create holes to exploit. 

Our interviewees expressed a need for more digital and data-driven tools to help prevent anti-selective behavior as the industry modernizes. The MIB Data Vault used in this analysis provides a good example of such a tool. As more insurers participate in this industry-wide contributory database and scale increases, the database will enable a more robust exploration of anti-selective behavior. Without such tools, an individual insurer has very limited ability to detect policies held with other carriers. Collectively identifying “red flags” can enable insurers to ask more questions of applicants and reduce anti-selection risk.

Looking ahead, insurers we interviewed noted that data and artificial intelligence may enable more efficient ways to flag fraudulent activity in the future. Armed with this information, insurers should be able to more easily identify suspect cases, take appropriate action, and properly price policies.

Conclusion

Anti-selective behavior from only a small subset of insurance customers hurts policyholders. Elevated claims experience is passed on to consumers in the form of higher premiums, and consumer-friendly innovation is stifled when anti-selection cannot be adequately mitigated. 

The need for more robust anti-selection detection and prevention tools is apparent. Insurers who can flag potential misrepresentation are better equipped to price policies and reach target consumers. The result: an opportunity for a clear competitive advantage with the ability to charge more attractive rates for the vast majority of policyholders.

Appendix – Data Notes

  • The analysis of the MIB Data Vault focused on data from issue years 2015+ due to the lack of termination data prior to 2015. 
  • Policies marked as “not taken” were removed from the analysis.
  • Additionally, we filtered out policies potentially involved in COLI/BOLI, as we consider the experience of these policies not to be representative of the industry.
  • It is also worth noting that we conducted the analyses in this report on a face amount basis, meaning that we determined the distributions for stacking, churning, and total policies as a percent of total face within any of those groups.
At RGA, we are eager to engage with clients to better understand and tackle the industry’s most pressing challenges together. Contact us to discuss and to learn more about RGA's capabilities, resources, and solutions.

Special thanks to Taylor Pickett, Joel Phillips, Scott Fritsche, Jessica Caracofe, and the MIB Team.

More Like This...

Meet the Authors & Experts

Julianne Callaway
Author
Julianne Callaway
Vice President and Senior Actuary, Strategic Research, Global Actuarial Pricing and Research
Leign Allen
Author
Leigh Allen
Associate Vice President, Strategic Survey Research, Global Actuarial Pricing and Research 
Colin-Deforge
Author
Colin M. DeForge
Vice President, Underwriting, U.S. Underwriting, U.S. Individual Life
Kaitlyn-Fleigle
Author
Kaitlyn Fleigle
Associate Actuary, Strategic Research, Global Actuarial Pricing and Research

References

  1. See the Appendix for data information and other analysis-related notes.
  2. Within this analysis, the focus was on individuals who purchased a new policy from a different carrier. However, it is possible for churning to occur within the same company.
  3. Every company may have different limits regarding face amount or issue age for automated underwriting or simplified issue. $1 million was believed to be a reasonable cutoff for the definition of stacking, but other face amounts could be justified and would alter the analysis.
  4. https://www.soa.org/4adc45/globalassets/assets/files/resources/research-report/2023/acc-underwriting-practices-survey.pdf