Life insurance new product development generally suffers from two major issues:
- The long lead times required to generate a new product idea and subsequently bring that idea to market.
- The widespread dissatisfaction with the quality of innovation in the current crop of new product ideas.
To assess these issues more closely, RGA conducted its first global survey of life insurers in mid-2014 to determine and quantify possible root causes. Responses were received from more than 100 product development leaders in 12 countries in Europe, Asia, and the Americas.
Answers addressing the insurance product development cycle indicate clearly that speed-to-market remains an ongoing issue. The average time needed for a company to take a new product idea through development to launch currently ranges from six to nine months. Variations depend, for the most part, on two factors: whether the product is savings, risk or living benefits, and the geographic region in which the product is being developed. Insurers in the Europe, Middle East and South Africa (EMEA) region, for example, bring more products to market and do so more quickly than do insurers in the Asia Pacific (APAC) region and in the Americas.
As for quality of innovation, it was surprising to discover that life insurers in most countries do not actively solicit market input from consumer focus groups, market surveys or informed external experts such as reinsurers, actuarial consulting firms or their company’s head offices. Instead, they continue to rely primarily upon competitive intelligence and existing market practices.
The selection of results presented herein reflect several stark implications for today’s executives managing life insurance product development. The benchmarks that will be established will represent opportunities to improve the new product development process as well as enhance innovation for life, living benefits and savings products.
Issue One: Slow Product Development Cycles
Average idea to launch time
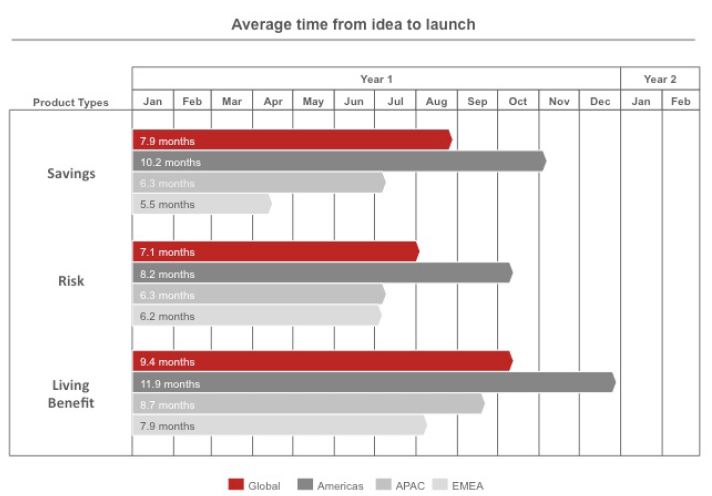
Around the world, the average time needed to launch a new product from concept to sale ranges from six to twelve months. Risk products (individual mortality products without cash values, such as term life) take, on average, 7.1 months, and living benefits products such as a critical illness or long-term care, which provide payouts triggered by a health-related event, take approximately nine months. (Please see Figure 1, below.)
Differences do exist, both from region to region and within product lines. Insurers in the Europe, Middle East and Africa (EMEA) region, for example, have the shortest cycle time length for creating and launching savings and risk products – about 20% faster than other regions. The idea-to-launch cycle for insurers in the Americas, on the other hand, averages about two to three months longer.
For companies in the Americas, the living benefits product development cycle averages nearly a year, while EMEA insurers need slightly more than seven months and APAC insurers about eight months. The longer development times for Americas respondents are indicative of greater challenges experienced in product design, pricing benefits, and in the design and implementation of administration systems than exist for either APAC or EMEA insurers.
Figure 1:
Average time from idea to launch by region
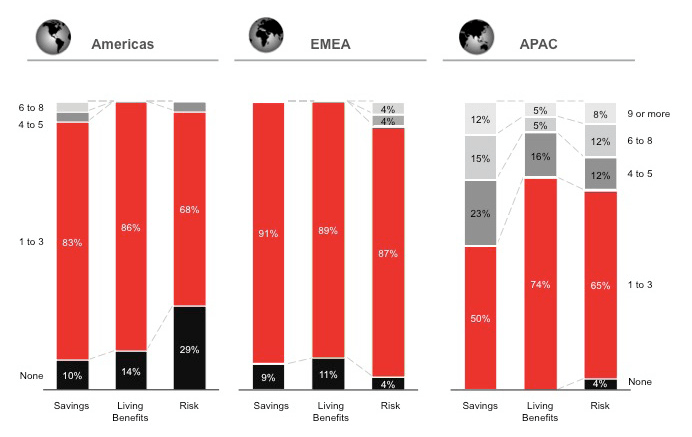
The vast majority of life insurance companies develop between one to three new products per year in each of the three product categories. (See Figure 2, below.) APAC life insurers, the most active product developers, create and launch significantly more new products in an average year in all product categories than do insurers in EMEA and the Americas.
Fewer living benefits products, however, are launched by insurers in all regions, highlighting this product line’s potentially significant design and implementation challenges.
Figure 2:
Average number of new product launches per year by region
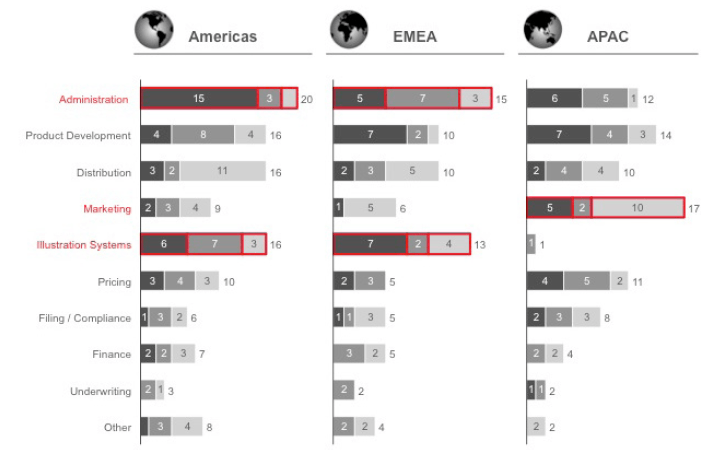
Bottlenecks
The major bottlenecks – that is, pain points in the product development cycle – are in administration, distribution, marketing, and illustration system development.
Insurers in EMEA and the Americas named administration and illustration systems as the top two areas needing improvement. Strengthening PD-related IT system development and capabilities could significantly reduce the time it takes to bring a product to market.
APAC insurer responses indicate they face a different set of functional challenges. They often experienced difficulties in designing benefits and marketing the products. This could be due to the fact that more than 25% of APAC insurers launch six or more products a year.
Although APAC insurers reported coping effectively with IT illustration system development, follow-up interviews with respondents in Australia, Indonesia, Singapore and Malaysia found that many companies in this region were more reliant upon manual processes than were their Americas counterparts. While APAC insurers can develop and launch many products quickly, they are not currently reaping economies of scale due to the lack of IT systems for administration and new business that can handle high volumes.
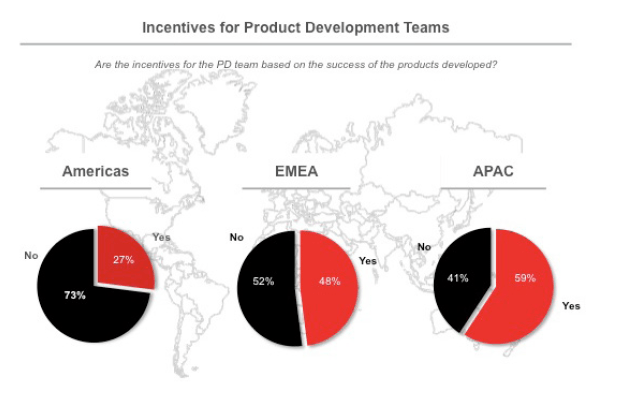
Use of incentives
Another area of investigation was whether providing incentives to key members of PD teams can reduce development times.
More than twice as many APAC insurers (59%) were found to use incentives for their product development teams than insurers in the Americas (27%). (Please refer to Figure 4, below.) Carefully designed performance-based compensation for these core employees may help motivate teams.
Figure 4:
Use of incentives by region
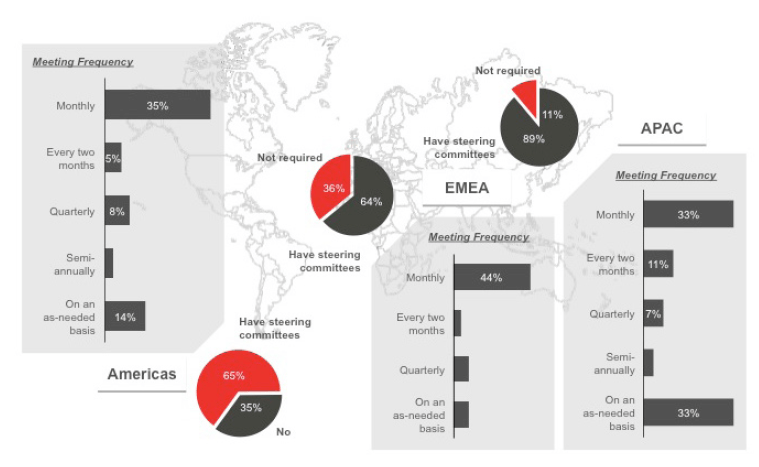
Steering committees
Dedicated product development steering committees typically set their company’s PD strategy, manage the ongoing book of work, and provide formal governance. In RGA’s view, a well-structured PD steering committee can ensure sufficient internal support to enable efficient, effective product development.
Currently, 85% of APAC insurers have formal product development steering committees in place. APAC insurer committees meet monthly, which is necessary given the growth of that market and the number of new products being launched. In comparison, about 65% of insurers in the EMEA and Americas regions have established and are using these committees.
Figure 5:
Product development steering committees by region
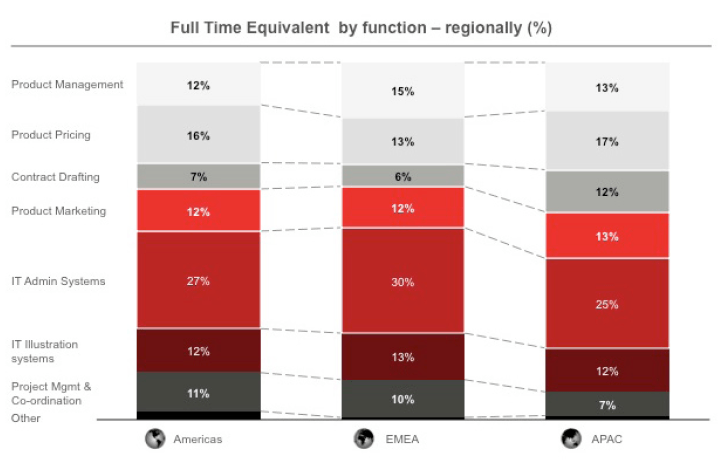
Headcount allocation
The survey also sought to examine and compare how insurers allocate functional resources (headcount) from region to region, whether there are regional differences in allocation breakdowns, and whether these differences might have any impact on new product development.
Generally, insurers allocate functional resources to the bottlenecks identified in Figure 3. Insurers in the Americas and EMEA share similar headcount allocation patterns, with most resources allocated to IT administration system development. (It should be noted that IT system development was cited as a major area for improvement by many respondents in the Americas and EMEA.)
APAC insurers reported slightly lower headcount allocations than their Americas and EMEA counterparts to IT administration systems. APAC insurers also devote fewer functional resources to project management. This could imply that even though many of the processes in this region are manual, the administrative and support systems of APAC insurers may produce greater efficiencies.
In terms of drafting of policy contracts, APAC insurers devote significantly more functional resources to this need than do other regions. This might be related in part to the regulatory requirements for receiving approval prior to launching a new product.
Figure 6:
Headcount allocation by region
Issue Two: Information Sources That Support Innovation
Satisfaction with output levels
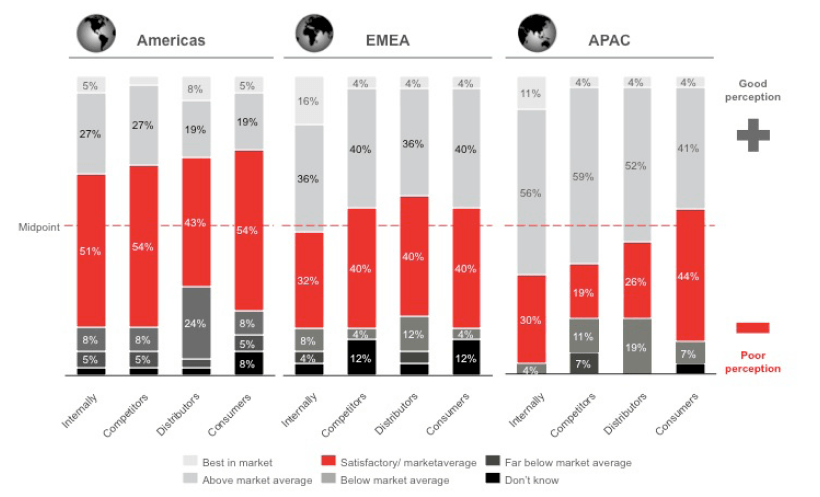
When asked to assess the level of perceived satisfaction with new products launched into markets, all respondents in every location indicated their companies viewed their new products more positively than might their distributors and end-consumers. (See Figure 7, below.)
On average, APAC insurers are more satisfied with the new products they develop and launch, whereas insurers in the Americas are the least satisfied. More than 25% of Americas respondents reported their distributors hold below-market-average perceptions of their new products. In addition, 12% of EMEA respondents indicated they do not have clear insight into the views of their core competitors and end-consumers.
A lack of perspective from those who are the potential buyers and marketers of the products could lead to less innovation and product suitability, and might impact the acceptance of new products introduced into a market.
Figure 7:
Ratings of product development results by region
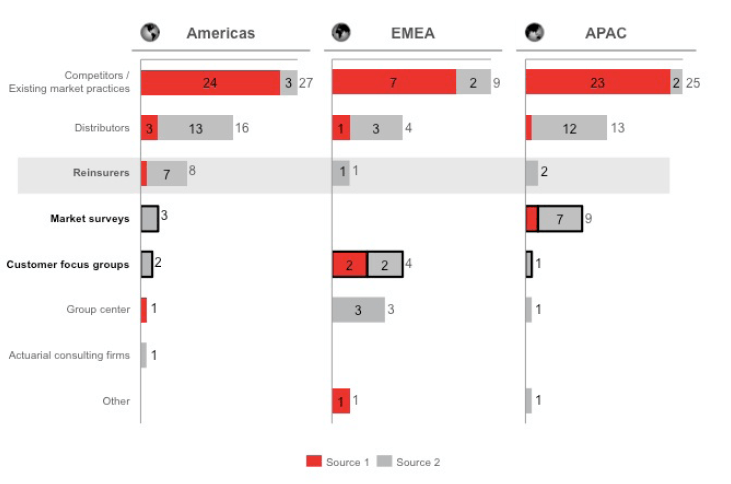
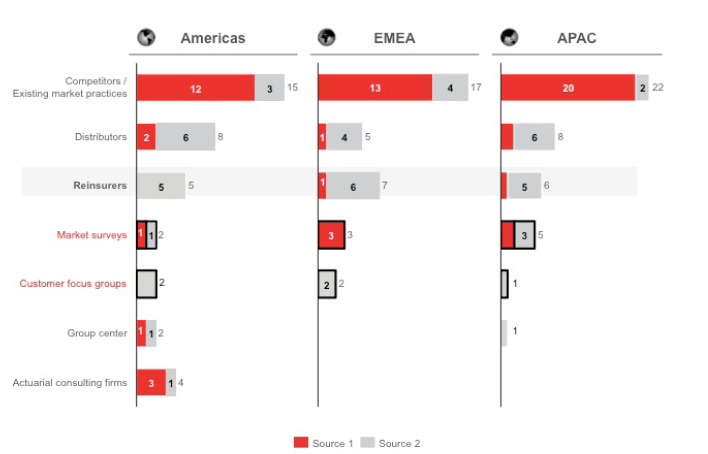
Information sources that support innovation
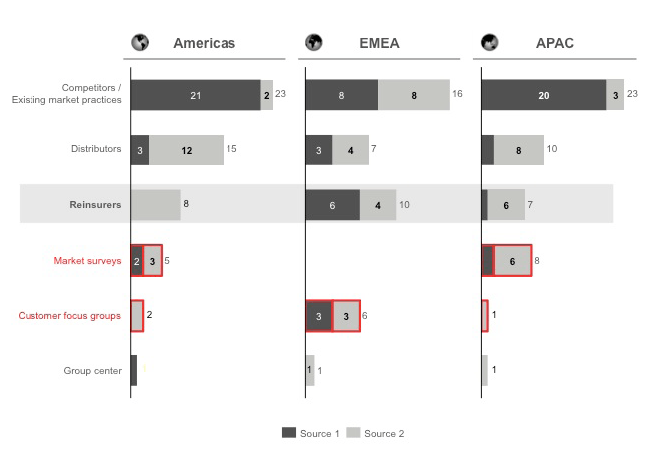
Around the world, life insurers make limited use of end-consumers to inform their PD efforts, whether via focus groups or market surveys. Instead, they rely strongly on existing products and trends in the market as their primary information sources when designing new products. This could be a root cause for the overall lack of innovation and poor consumer satisfaction. (See Figure 7 on the previous page.)
Distributors are commonly secondary sources of competitive intelligence about products and trends for primary insurers. This highlights a second possible factor: insurers continue to treat distributors instead of end-consumers as their clients, and are therefore more likely to optimize new product designs around what distributors want to sell instead of what consumers want to buy.
Partnering with external expert advisors such reinsurers and actuarial consultants can provide primary insurers with significant insights that can lead to market innovations. In addition, better utilization of consumer inputs might provide better targeting of consumer needs and therefore more innovative product solutions.
Figure 8:
Sources of product development information – savings products
Sources of product development information – living benefits products
Sources of product development information – risk products
Summary
The selected survey findings presented here indicate clearly that significant opportunities exist to shorten and strengthen the product development cycle, increase the volume of new product issuance, and improve innovation by introducing and incorporating information from sources such as the current market and end-consumers. These will help companies develop and adapt products to meet real market needs.
If you would like more information, please contact your local RGA office or the regional representatives listed on the following page.