In 2013, Reinsurance Group of America (RGA) and TransUnion LLC
(TransUnion) began to research the protective and predictive nature of
credit behavior for the purpose of understanding relevance as it pertained
to mortality risk.
RGA’s goal was to understand the relationship between
credit attributes and mortality outcomes. Given credit data’s successful
implementation in analyzing risk in adjacent markets, like property and
casualty insurance, it appeared to be an ideal behavior to explore for the life
insurance market.
In 2014, a product version of a credit-based insurance score, TrueRisk® Life, was
finalized by TransUnion. As discussed in the 2019 published article (Rushing,
Kueker), RGA validated the newly created model by analyzing the risk score’s
ability to predict mortality in the credit active population. In the decade since,
the underwriting tool has proven itself to be a valuable asset to American life
and group insurers. While not explicitly covered in this study, TrueRisk® Life
has demonstrated, via studies of carrier insured blocks, to enable improved
mortality risk segmentation and simplify the underwriting process, removing
friction, cost and time to better meet customer expectations.
With the aim of building on the insightful 2019 whitepaper, this paper offers
a fresh look at U.S. Population mortality trends. RGA studied TrueRisk® Life’s
ability to segment mortality risk by leveraging a dataset from TransUnion
containing 50 million lives, 6 million deaths, and 500 million scores. The study
covers years 1999-2020 – a period made possible by a compilation of death
sources, provided by TransUnion.
Armed with this new data, RGA has targeted key research topics including:
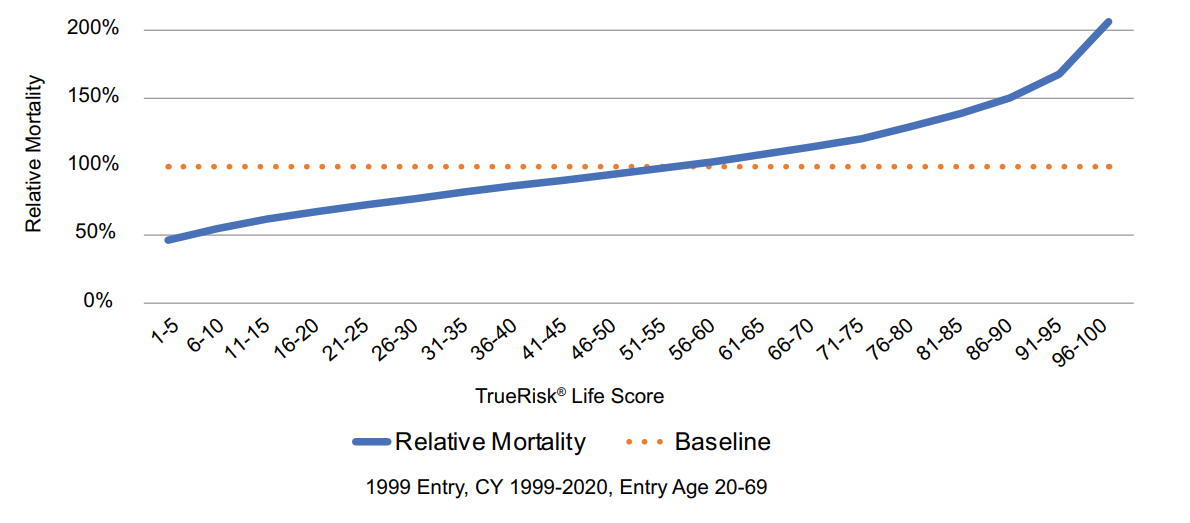
- TrueRisk® Life as a Long-Term Predictor: This updated population study builds on the previous publication (Rushing, Kueker), following subjects for an extensive 22-year follow-up. TrueRisk® Life achieves 4.48x segmentation between the best and worst risks (1-5 and 96-100, respectively) over the study period (Figure 1). Performance would likely be even stronger if deaths were not disproportionally underreported for people with high TrueRisk® Life scores.
- Score Performance in Recent Years: TrueRisk® Life continues to demonstrate strong predictive power when applied in more recent years despite a changing external environment (Figure 7, full report).
- Score Persistence
- Over Time: Distributions of population TrueRisk® Life scores are less uniform in 2009 and 2019 than in 1999, with increasing prevalence in the highest/lowest scores (Figure 2, full report).
- In Individuals: Score persistence, the magnitude of score change for an individual year-over-year, depends on the initial risk. People with high or low scores tend to “persist” at their initial risk level, staying “favorable” or “unfavorable” risks for extended periods of time (Figure 13, full report). Age also plays a factor, with the youngest ages being somewhat less persistent than their older counterparts (Figure 12, full report).
- Persistence and Mortality: Due to responsive score movements, even in rare instances of sizeable score changes, we see a corresponding impact on mortality experience (Figure 14, full report).
- Scored People with Limited Credit History: Individuals with a limited credit history typically have very high scores (Figure 16, full report). The mortality segmentation for people with limited files is comparable to that of people with a more robust credit history (Figure 17, full report).
- Overall Take-Away: Over the entire study period, mortality was over 4x higher for the “riskiest” 5% of study entrants compared to the “safest” 5%.
Figure 1:
Relative Mortality by True Risk® Life Score
- RGA’s Take: RGA has leveraged its extensive industry experience with TrueRisk® Life to identify three key considerations for users and adopters:
- TrueRisk® Life continues to be a strong predictor of mortality, even over the extended time period in this study.
- While smaller individual movements will occur, score stability is very strong when considering ranges of scores that may be associated with certain underwriting rules. A large majority of individuals in the highest and lowest score groups remain within those groups when scored 5 years later.
- While a shift in population score distributions has occurred since the 1998 cohort in the original study, this shift predates the dozens of studies RGA has completed on insured blocks, whose relevance to carriers’ use of TrueRisk® Life is much greater. Consequently, the population shift observed in this study should not necessitate changes for carriers currently using TrueRisk® Life.
Download the Full Report