Statistical significance is widely used. Many researchers use the concept to confirm their theories. Others use it for data exploration, trying to determine what variables are “important” in their particular area of study.
There is growing skepticism about the use of this methodology. Some suggest it does not tell us what we want to know (Ioannidis, 2019). Others suggest that statistical significance has set back scientific research in general (Wassertein and Lazar, 2016). Many advocate that we should stop using p-values all together (McShane, Gal, Gelman, et al., 2019). This article explores the problems with statistical significance and suggests a commonly accepted pathway forward.
Why is Statistical Significance Used?
Statistical significance is designed to adjudicate between competing hypotheses. Specifically, this test evaluates an alternative hypothesis in the context of a null hypothesis. Let’s say we want to know some effect B, which represents the degree to which income affects mortality. The null hypothesis suggests that income does not affect mortality. Thus, B equals zero. The alternative hypothesis states that B does not equal zero, meaning that income affects mortality (either positive or negative). Tests of statistical significance assume that the null hypothesis is true and estimate the probability of observing the sample data. It’s important to note that while not discussed here, statistical significance in observational studies does not imply causation of any kind.
Statistical Significance Does Not Equate To Substantive Significance
Statistical significance does not represent substantive significance. Notably missing from the definition above is any discussion about the degree to which an effect is important. This is because statistical significance does not tell us if we have discovered an important effect. Instead, these tests tell us whether or not our confidence interval (at whatever chosen level) contains zero. This means that our effect estimates can be small and large, with variable uncertainty, and retain statistical significance. As a result, two important questions go unanswered. First, what is the size of the effect? (Does it matter?) Second, how certain are we about the size of the effect?
An Example
Returning to the example above, let’s again try to determine the effect of income on mortality (B). Assume that we have conducted three observational studies to understand this relationship. Each study has returned an estimate of B, and in each case, the effect is statistically significant. In a total vacuum, we might want to conclude that each study indicates that income affects mortality. But we know that statistical significance omits key information, so we would be left wondering if the effect was important.
Scholars have suggested graphically illustrating estimated effects from quantitative studies (Gelman and Paradoe, 2007). In general, these graphs should demonstrate several aspects of the results. First, they should display the effect of interest (the average effect). For example, we might plot the coefficients from a regression model (when interactions are absent). Second, these figures should illustrate the degree to which we are uncertain about the presented estimates. For instance, we could plot confidence intervals in addition to coefficient estimates from a regression model. With this information, an analyst can better understand the degree to which a variable affects an outcome of interest.
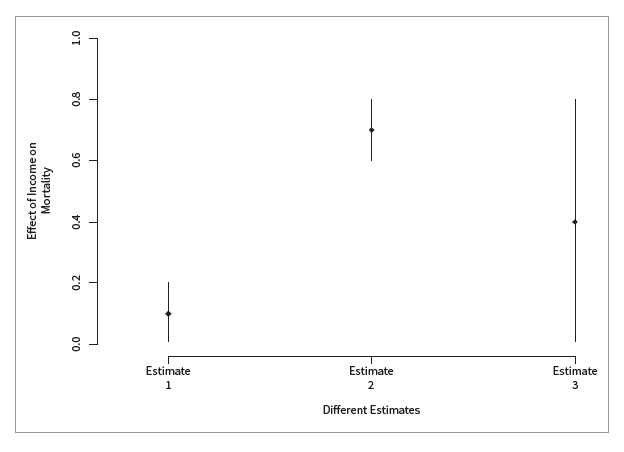
Figure 1 demonstrates that three statistically significant findings can represent different substantively meaningful findings. Returning to our previous example, Figure 1 displays three estimates of the effect of income on mortality, with 90 percent confidence intervals. As noted previously, each result is statistically significant at the 5 percent level, because each confidence interval does not contain zero.
What do these results suggest about the effect of income on mortality? Estimate 1 suggests that the effect of income on mortality is small with little variance. In this case, actuaries may choose to examine other variables to understand mortality bet ter. Estimate 2 suggests that the effect of income is large, with a small confidence interval. In this scenario, income is highly relevant to mortality, and we might consider developing products around this variable. Estimate 3, on the other hand, suggests that the effect could be large but that we are highly uncertain. Put another way, the confidence interval includes values near zero. This result suggests that if we were to repeat this experiment, we might find that there is little correlation between income and mortality. The substantive conclusion here is that the business needs to do more research to understand this effect better.
Conclusion
The previous example provides a path for analysts to understand how variables of interest affect mortality. Other ways analysts can check the value of their findings is by looking at measures of model fit (if a model is being used). For example, if an analyst is adding income to a model of mortality, they could show that the additional variable reduces the out-of-sample error for the model. This model fit can be estimated using holdout data or leveraging a fit statistic like AIC or BIC.


