Motor Vehicle Fatalities
Since the enactment of the National Traffic and Motor Vehicle Safety Act in 1966, the fatality rate per vehicle miles traveled (VMT) has steadily declined.3 During the period of 1967-2011, there were only 5 years where the fatality rate increased. However, from 2012 to 2016, the fatality rate increased in 3 out of 5 years – 2 of which were 2015 and 20164 (Figure 1).
The likely culprit for this disturbing increase in fatalities is an action that 70% of drivers admit to doing behind the wheel: checking their smartphones.5 However, it is very difficult to prove this definitively based solely on information from the Fatality Analysis Reporting System (FARS), a database that tracks every fatal automotive accident in the United States. The FARS database relies on information collected by authorities at the scenes of accidents, but there are numerous issues at play, which result in the true rate of cell phone-related distractions being severely under-reported.
The dangers of distracted driving have been known for years. Research from the University of Utah in 2006 indicated that talking on a cell phone increases the risk of an accident to a level similar to that of driving while intoxicated.6 While different studies may show varying degrees of risk, the consistent conclusion is that distracted driving significantly increases the risk of being involved in an accident.
FARS Database Analysis
The FARS database, which is maintained by the National Highway Traffic Safety Administration (NHTSA), contains detailed information on fatal automotive accidents. With this information we can look at some major factors that influence fatalities.
The following charts show the probability of survival (survival rate) from fatal car crashes, i.e., car crashes involving at least two motor vehicle occupants and resulting in at least one motor vehicle occupant fatality. The data for these charts includes fatal crashes from 2010-2015.
Vehicle Safety Improvements
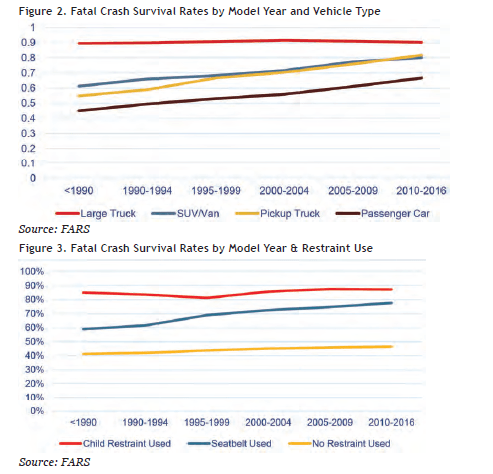
This first graph (Figure 2) shows how much safer vehicles have become over the past 3+ decades. It’s no surprise that large trucks have always had high crash survival rates purely due to their massive size. However, a look at what constitutes most personal vehicles on the road shows that the probability of survival goes up dramatically with newer vehicles regardless of type. Technological improvements in automobile design such as airbags, anti-lock brakes, crumple zones, stability control and more have all played huge roles in making modern cars safer than ever.
Seatbelt Effectiveness
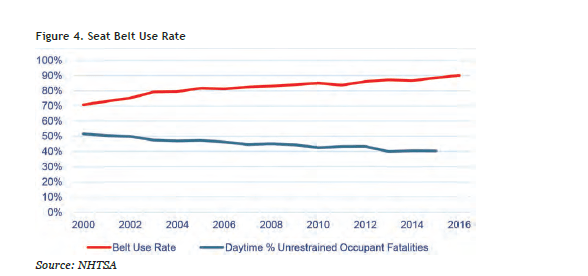
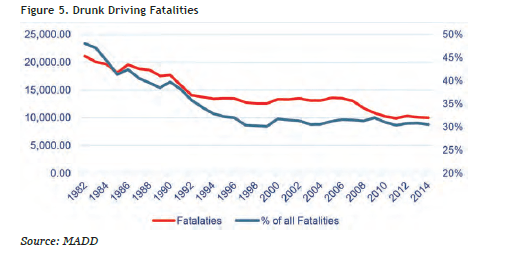
The next graph (Figure 3) looks at how the survival rate changes by model year and restraint use. One somewhat surprising result is how effective child safety restraints are at preventing fatalities regardless of the age of the vehicle, given the disparity in occupant survival rates overall by model year. The key point of this graph, however, is the disparity between the survival rates of occupants who use seat belts vs. those who do not. Seat belts have always been effective, but as can be seen with each new model year, the effectiveness of seat belt use has increased while the survival rate is fairly level across all model years for unrestrained passengers. Not only has the effectiveness of seat belts increased, the actual seat belt use rate has risen from 70% in 2000 to 90% in 20161 (Figure 4).
Drunk Driving
Drunk driving fatalities have dropped substantially over the past 30 years, both in raw numbers and as a percent of all fatalities. The statistics for the following graph (Figure 5) were taken from the Mothers Against Drunk Driving (MADD) website, which shows the decrease in the number of drunk driver-involved fatalities since 1982. Rates have remained relatively flat since 2011.2
One possible reason for the relatively stagnant rates of drunk driving fatalities could be related to the increase in cell phone distractions. Clearly, a drunk driver who is also distracted by a cell phone is going to be that much more dangerous on the road. However, once alcohol involvement is identified in an accident, police are unlikely to conduct any further investigation to determine if distracted driving was also a cause.
Driver Distraction
Given the information above, it is clear that increases in vehicle safety, increased seat-belt use and reduced drunk driving rates have all put downward pressure on the automotive fatality rate per VMT. However, if the overall fatality rate is going up despite these major factors pushing it down, what factors are causing it to increase?
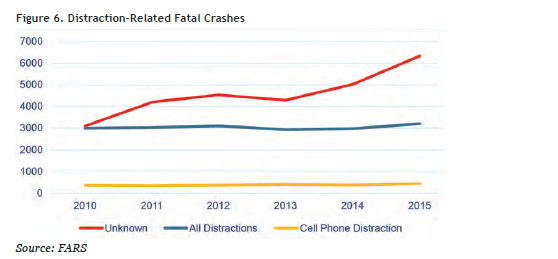
A look at the distracted driving statistics from FARS tells only a part of the story. In what is a very surprising statistic, the level of distracted driving-related fatalities remained relatively flat from 2010 to 2015. Within the distracted category, only 442 accidents were identified as involving a cell phone-related distraction in 2015, up from 366 in 2010. However, the number of fatal accidents where distraction involvement was reported as unknown more than doubled from 2010 to 2015 (Figure 6, next page).
A few disturbing trends in traffic fatalities from 2010 to 2015 can be seen in the following bar chart (Figure 7), which shows the percentage increases in fatalities over that period.
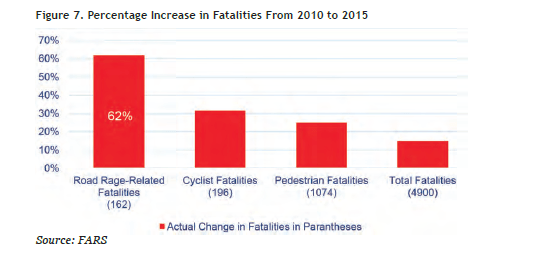
Why is it that since 2010 the number of unknown distraction cases has gone up more than 100%, the number of cyclist fatalities has gone up more than 30%, and pedestrian fatalities have gone up by 25%? Even more telling, why has the number of pedestrians killed in a single vehicle incident with a sober driver increased 32%, and all of this while the overall increase in fatalities was only 14.8%? Clearly, the data isn’t telling the whole truth when it comes to distractions.
Underreporting of Cell Phone Use
A paper by the NSC published in 2013 investigated the underreporting of cell phone use in national crash data, in which 180 fatal crashes were reviewed where evidence indicated a driver was using a cell phone. In 2011, only 52% of the cases reviewed were coded by FARS as having involved a cell phone-related distraction.7
Some of the issues addressed by the NSC when it comes to the issue of underreporting:
- Police often rely on drivers admitting to cell phone use, which is not something many willingly do or is not possible if they have died.
- Police may not fully investigate cell phone use if a more obvious violation such as speeding or lane departure is identified, or if a more serious violation such as driving under the influence is involved.
- If cell phone use is identified during post-crash investigations or civil court cases, crash reports may not be updated.
- Cell phone records are difficult to obtain. If they are obtained, the data must align with the precise moment of the crash, which is often impossible to pinpoint.
Additionally, in 2014 the NSC estimated that a minimum of 26% of all crashes involved some form of cell phone use.8 Considering how cell phones (especially smartphones) have become even more ubiquitous since then, it is possible that estimate would be even higher for 2017.
The Rise of the Smartphone
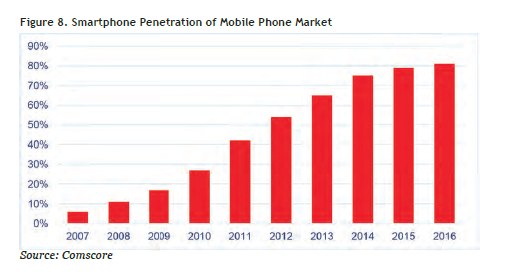
In 2016, smartphone penetration of the mobile phone market rose to 81%9 (Figure 8). The smartphone gave rise to the constantly connected culture where people are always only a finger’s touch away from phone calls, text messages, video calling, social media, email, cameras, games, etc.
According to a consumer survey by Deloitte in 2016, Americans alone collectively check their phones more than 9 billion times per day.10 The average person checks 47 times per day, and 18-24-year-olds check 82 times per day. Another study, from the online research company dScout, found that users on average engage in 76 phone sessions a day, averaging 2,617 taps/swipes/clicks a day, and heavy users engage in over 130 sessions a day and average 5,427 daily touches.11
A 2015 survey from AT&T found that 70% of people engage in smartphone activities while driving.5 Additionally, 62% of drivers keep their smartphones within easy reach while driving – in their hands, laps, cup holders, or on the passenger seat.
Prevention: Regulations and Technology
Numerous studies have proven the risks of cell phone-related distractions. Yet 70% of drivers still engage in smartphone activities, despite the fact that texting is banned in 46 states and is partially restricted in two additional states (Figures 9 and 10). How can drivers be prevented from engaging in an illegal activity which is highly dangerous?

Regulatory Efforts
Additional regulations and stricter enforcement of laws against distracted driving are one approach for improvement. Primary enforcement of a law means that a police officer can pull someone over because of that violation and issue a ticket. Secondary enforcement of a law means the violation can be added on to other primary violations.
One new law enacted in California, effective January 1, 2017, bans holding and operating a phone while driving for any reason, and only allows for single swipe or clicks of a phone mounted to a windshield or dashboard. This is the strictest law to date limiting the use of cell phones while operating a motor vehicle. However, the base fine for a first-time violation is only $20.
Research has shown that bans on cell phone use have done little to actually curb accident rates.12 A speeder can be caught with radar, a drunk driver can be identified with a breathalyzer test, but a cell phone violation relies solely upon visual recognition. Drunk drivers can be screened at checkpoints and strict punishments are a major deterrence. Yet cell phone distractions, which are extremely dangerous, are intermittent, cannot be screened with checkpoints, and do not come with severe legal punishment.
Other legislative efforts being pursued revolve around requiring smartphone makers and app developers to disable certain features while driving.
Awareness and Education
Legislation and regulations are only effective if the punishment for doing something is enough to deter people from doing it in the first place. While studies may show texting and driving is as dangerous as driving under the influence, it is unlikely to see penalties as harsh as those for a DUI be given out for texting and driving.
Public awareness and education on the risks of distracted driving will be crucial to curbing the behavior. In the US, campaigns such as www.distraction.gov from the US Department of Transportation are being created to educate the public and convince drivers to commit to not using their smartphones while driving.
Technology
In the spirit of “if you can’t beat them, join them,” technology can be used to curb the distraction of technology. Several innovations are taking place in the automotive industry, focusing on technology such as lane-keeping assist and emergency braking. These features are already being offered on many new vehicles, but the National Highway Traffic Safety Administration (NHTSA) and the Insurance Institute for Highway Safety (IIHS) are already working with automakers to make automatic emergency braking standard on all new vehicles.
According to the IIHS, vehicles equipped with automatic braking reduced rear-end crashes by 40%, and the forward collision warning feature yielded a 23% reduction in front-end crashes.13 If all vehicles on the road had been equipped with automatic braking, there would have been 700,000 fewer rear-end crashes in 2013.13 With the average age of vehicles on US roads being more than 11 years old, it will take some time for this technology to permeate.14
The other major technological advancement which has been making a lot of headlines lately is around autonomous vehicles. Tesla is famous for introducing an autopilot feature in its cars that allows a driver to be hands-free under certain conditions. Autonomous vehicles have tremendous implications for all facets of vehicle safety and it will be exciting to follow their development.
Conclusion
Despite all of the headway made in vehicle safety, drunk driving prevention and seatbelt use rates, the fatality rate on US roads has increased in back-to-back years. While the FARS data does not show an increase in distracted driving-related fatalities, it is difficult to ignore all of the evidence to the contrary. Research suggests that cell phone-related distractions are severely underreported. Several studies have shown dramatically increased probabilities of being in an accident while using a smartphone, and 70% of drivers admit to using their smartphones while they drive. It is clear that driver distraction from smartphones is causing a reversal in vehicle fatality rates per VMT despite so many other factors that are continuing to reduce the rate.
Several regulations have been put in place to ban a certain extent of cell phone use while driving. However, these efforts have not shown any effectiveness in reducing crash rates stemming from distracted driving. Enforcing cell phone restrictions is difficult, and current punishments are not severe enough to truly deter the behavior. Absent a complete cultural shift in the attitude toward smartphone dependency, it is going to be very difficult to stop distracted driving.
Technological innovations such as various crash avoidance systems and semi-autonomous and autonomous vehicles will help with the symptoms, but will not cure the disease.
.png?sfvrsn=3d7ea788_2)