Insurance is built around anticipating what may happen tomorrow based on what we know today. When it comes to COVID-19 mortality, what we know today is clouded by uncertainty.
To assess the potential mortality impact of the COVID-19 pandemic on an insured portfolio, we must estimate how many people have been infected with the virus (the infection rate) as well as the probability of an infected person dying as a result of the disease (the infection fatality rate; IFR). It is important to note that the case fatality rate (CFR) of COVID-19 is not the same as the IFR; the CFR is the ratio between the number of confirmed deaths (not total deaths) from the disease and the number of confirmed cases (not total cases).
Insurers may find it useful to assume an IFR in combination with an infection rate. Together, the infection rate and infection fatality rate will tell us about COVID-19's cause-specific population mortality rate. However, determining an IFR assumption can be a challenge when territory-specific data isn't available.
Different IFR sources
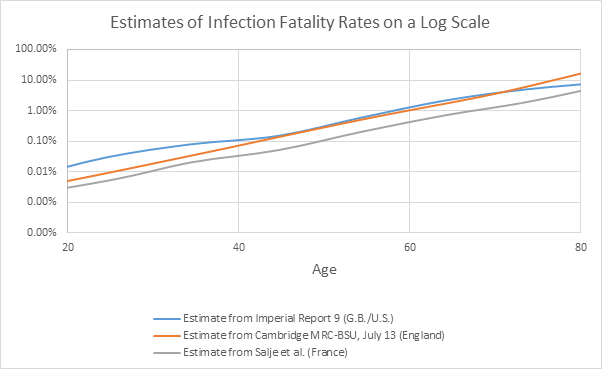
To date, researchers have published a limited number of IFR estimates based on different populations, including:
The following chart illustrates three of the IFRs mentioned above:
What can insurers do when an IFR estimate for a population isn’t available? It is possible to derive simplistic estimates from seroprevalence studies, which estimate the prevalence of SARS-CoV-2 infections through the presence of antibodies in blood samples by dividing reported COVID-19 deaths by the approximate number of infected individuals. These are considered simplistic estimates because they ignore complicating factors, such as the time period between infection and death, differences in definitions of what qualifies as a COVID-19 death, differences in population health and risk factor profiles, how accurate the blood tests are, and so on. Results from the Spain Ministry of Health’s final report, published on July 6, estimated that around 5.2% of Spain’s population had been infected by June 22 – roughly 2.44 million individuals if we assume the local population is 47 million people. When dividing the 28,324 COVID-19 deaths reported as of June 22 by the infections, we get a simplistic overall IFR of around 1.16%.
Choosing the appropriate IFR
In some cases, there may be an IFR estimate that is obviously most appropriate. If we were looking at a projection for France, for example, it would make sense to use the reported IFR from Salje et al. However, it is important to remember that this estimate reflects a particular point in time, and it may differ in the future, e.g., if new treatments are developed.
In other cases, where the estimate hasn’t been published for a particular territory, we may need to select an IFR that is likely to be most appropriate for the population of interest and recognize that there are uncertainties in this approach. The choice of which IFR to select can be informed by views on the likely shape of COVID-19 infection rates by age in the population of interest. This relationship between the infection rate, IFR, and COVID-19 mortality rate is reflected in the following calculation:
Infection rate x IFR = COVID-19 mortality rate
For a given COVID-19 mortality rate, choosing an age-related IFR is equivalent to choosing the age-shape to the infection rate.
As an example, the chart below shows the implied percentage of Quebec’s population that would be infected based on the Canadian province’s reported COVID-19 death data and the three IFR curves above.
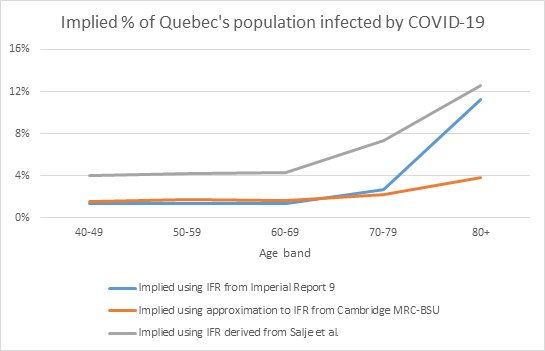
The choice of IFR could be based on the (re)insurer’s views on which of these shows the most likely age-shape to infections for Quebec:
- If the age-shape to infections followed the age-shape to confirmed cases, with a significantly higher level seen in the 80+ group, then the estimate from either Imperial Report 9 or Salje et al. would be most appropriate, with Salje et al. leading to higher infection estimates at each age compared to Imperial Report 9.
- Alternatively, if it was felt that the age-shape to confirmed cases was as a result of Quebec’s testing strategy, perhaps through higher testing of the 80+ group, and that the age-shape to infections would be flatter, then the Cambridge MRC-BSU report would be most appropriate.
Summary
Until IFR estimates across all populations of interest are reported, (re)insurers will need to recognize the uncertainty inherent in using IFR estimates derived from one population in making a projection for another. Sensitivity tests using several different IFR curves may be helpful. However, we should be mindful of what the selected IFR implies for the age-shape of the infection rate and recognize that IFR estimates derived from current data are likely to change in the future as new treatments are developed. Insurers further need to consider what differences may exist in the infection and infection fatality rates for the insured sub-populations.