As the name implies, CGM devices offer better real-time measurements of blood glucose levels.
An estimated 7 million individuals in the US have adopted the technology, representing approximately one out of four potential users. Glucose is typically measured from the (tissue) interstitial fluid and reported once every 5 minutes, providing an exceedingly detailed picture of glucose homeostasis compared to the traditional daily finger prick. Most CGM devices trigger an alarm in response to hypoglycemia, and complex algorithms have been developed that are guiding insulin regimens in a much more tailored fashion. However, despite remarkable advances in technology, CGM devices still have distinct limitations, and the long-term mortality benefits remain unclear.
With a flash glucose or intermittent glucose monitoring system (iCGM), glucose is continuously recorded by a sensor with a filament placed under the skin. It is not considered a true “continuous” system as a scanner must be intermittently placed over the skin to take the measurement. It does give both current readings and a readout of measures over the last 8 hours. It can reasonably be thought of as a replacement for finger sticks. The Abbott FreeStyle Libre system is the only intermittent glucose monitoring system currently available in the US. Because the glucose is measured in the interstitial fluid (instead of blood), it is generally recommended an individual check blood glucose with a traditional finger stick if blood sugars are rapidly changing or do not match the individual’s symptoms. Current models, however, are marketed as factory-calibrated and do not require routine calibration between readings and blood glucose measurements. The sensors need to be replaced every 14 days.
As the name implies, CGM devices offer better real-time measurements of blood glucose. However, these devices still measure interstitial glucose and thus may lag behind blood glucose measurements. For this reason, and for most devices, it is recommended that the individual calibrate measurements routinely. The continuous nature of the device opens a world of analytic possibilities. A key benefit is the setting of alarms to notify the individual both of hypoglycemia and to prevent diabetic ketoacidosis (DKA). CGM devices offer greater capabilities of remote sharing of data with treating physicians. These systems can be further subdivided into “open” and “closed” loop systems. The loop in this case refers to the interaction between glucose sensor and insulin delivery system. In a closed loop system, this interaction takes place automatically. The majority of systems are still open or hybrid systems, requiring some form of user input prior to adjusting the insulin dose. Figure 1 (next page) offers a simplified comparison of the system types.
Figure 1
Comparison of CGM System Types
Characteristic | Real-Time CGM | Flash CGM |
|---|
Monitoring | Button-push | Scanning |
Automated alarms | Yes | No |
Calibration FS | Yes | No |
Closed-loop | Yes | No |
Open system | Yes | No |
Remote sharing | Yes | No |
Source: Adolfsson. Eur Endocrinol. 2018 Apr, 14(1): 24-29.
Benefits and Limitations of CGM
A key benefit of CGM is to address the limitations of hemoglobin A1c (HbA1c) as a measure of diabetes control. This measure can be inaccurate in several clinical contexts including anemia, smoking, hemoglobinopathies and pregnancy. It serves as a measure of average blood glucose over the last 2 to 3 months but gives limited information about the peaks and valleys of glucose control, which of course are heightened in those individuals requiring insulin. Candidates for CGM then include the following:
Many Type 1 diabetics.Insulin-dependent Type 2 diabetics.Intensive insulin therapy.Hypoglycemic history (especially with hypoglycemic unawareness).Highly variable “brittle” diabetics.Further, the avoidance of finger stick requirements can improve compliance especially in younger or more active individuals. As detailed below, there is increasing evidence that CGM can provide superior glucose control.
However, there are several limitations. As mentioned, given the calibration and validation requirements of some systems, CGM cannot entirely replace blood glucose checks. Other individuals may be unsuitable candidates given complexity, cost and comfort concerns. The lag time effect between interstitial and blood glucose has not been eliminated with newer models. Finally, some personalities may not mesh well with CGM due to information overload or over-reliance upon the algorithms.\
Interpreting a CGM Report
An important trend prompting increasing utilization of CGM has been standardization and simplification of the reporting, resulting in a single-page ambulatory glucose profile (AGP) report (Figure 2).
There are several new measures which underwriters will need to consider in their risk assessment:
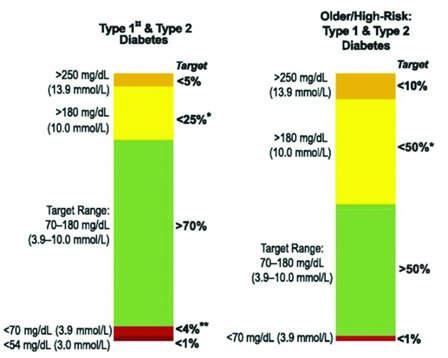
Time in range (TIR) – The percentage of time blood glucose is within the target range. As a general rule of thumb, 70% of readings should be within the desired target range. The target range may vary significantly according to several factors such as diabetes type, age, frequency of hypoglycemic, or DKA episodes. Figure 3 (next page) offers sample target ranges for two commonly represented groups. In addition to the target range, time in the hypoglycemic range (<70 mg/dl) should be kept to less than 4%. The time spent below 70 mg/dl may also be reported as time in hypoglycemia (TIHypo). There is increasing evidence that TIR, like HbA1c, correlates well to the likelihood of diabetic complications.
Figure 2
Sample Graph from AGP Report
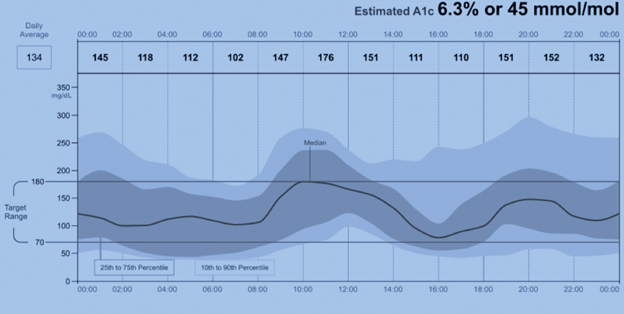
Glucose management indicator (GMI) percentage is an estimate of hemoglobin A1c. Previously some reports used the term “estimated hba1c”; however, the FDA recommended the term be replaced due to potential confusion that it is synonymous with the traditional HbA1c measure. This can be calculated using another measure commonly found in AGP reports, the mean (or average) glucose:
GMI (%) = 3.31 + 0.02392 × [mean glucose in mg/ dL] or 12.71 + 4.70587 × [mean glucose in mmol/L]
While HbA1c is typically a measure of average blood glucose over 120 days, GMI can be representative of a much smaller period of data (as little as 14 days). GMI may also differ from Hba1c given the limiting factors described above that change the average life span of the red blood cell or the affinity for the hemoglobin molecule for glucose. However, as long as those factors remain stable, the delta between GMI and HbA1c for a particular individual also tends to remain stable. For underwriting purposes, the differences could be considered modest especially with a relatively stable GMI.
Figure 3
Sample Target Ranges
Measures of Glucose Variability: Standard Deviation (SD) and Coefficient of Variation (CV) Standard deviation is likely the more familiar of the two terms and measures the average variability from the mean. The challenge with standard deviation is that it rises when the mean rises, which can give an inaccurate picture in the context of elevated average glucose readings. The coefficient of variation (CV) is the ratio of the standard deviation to the mean, expressed as a percent; it essentially helps correct for differences in the mean. The target CV is generally less than 36%.
Summary of Evidence
A growing body of evidence supports the use of CGM in selected diabetic patients. While endpoints can be quite diverse, trials have generally sought to demonstrate better control with the use of CGM or the avoidance of hypoglycemia.
Most trials target measures of control. The GOLD trial in 20171 was a crossover trial of 161 Type 1 diabetics on multiple daily insulin (MDI) injections randomized to CGM (Dexcom G4 PLATINUM) or conventional therapy. Treatment periods were for 26 weeks, separated by a washout period of 17 weeks. At the conclusion of the trial, the mean difference in HbA1c at the end of treatment periods was 0.43% (7.92% vs. 8.35%). Glycemic variability was also reduced in the treatment group.
That same year, the DIAMOND trial reported both positive results in Type 1 diabetics2 and Type 2 diabetics on MDI3. The latter group included 158 individuals randomized to CGM or traditional monitoring. At 24 weeks, mean HbA1c levels decreased to 7.7% in the CGM group and 8.0% in the control group at 24 weeks, resulting in a modest but statistically significant adjusted mean change of −0.3% [95% CI, −0.5% to 0.0%]; P=0.022.
TIR has also improved with the advent of CGM. In 2006, for example, Garg et al.4 demonstrated a 26% improvement in TIR among 91 individuals with Type 1 and Type 2 diabetes. Accordingly, this was accompanied by 23% less time hyperglycemic and 26% time less time hypoglycemic.
Several trials have focused on the prevention of hypoglycemia as the primary endpoint. Bolinder et al.5 enrolled 328 patients with well-controlled Type 1 diabetes and then randomly assigned them to flash glucose monitoring or traditional blood glucose strips. Mean TIHypo was reduced in the flash glucose monitoring group.
While the above data is promising, it can also be observed that trial numbers are small, follow-up times are short, and long-term data is sorely lacking around the use of CGM to prevent diabetic complications, and in particular, mortality.
Figure 4
Representative CGM Trial Summaries
Measure | Study | Summary |
|---|
HbA1C | DIAMOND Trial | Reduction of 0.6% in Type 1 diabetics. Reduction of 0.3% in Type 1 MDI. |
HbA1C | GOLD Trial JAMA 2017 | Reduction of 0.43% in Type 1 diabetics on MDI. |
Hypoglycemia | Bolinder et al. Lancet 2016 | Type 1 diabetics on MDI or CSII. 38% reduction in time in hypoglycemia. |
Hypoglycemia rtCGM vs. iCGM | Reddy, Diabetes Med 2018 | Type 1 diabetics randomized to rtCGM vs. iCGM. 2.7% rtCGM vs. 6.8% iCGM time in hypoglycemia. iCGM thought higher time in hypoglycemia at baseline. |
TIR | Garg et al., Diabetes Care 2006 | Insulin dependent Type 1 and 2 diabetics. 26% increase in TIR. 23% reduction in time in hypoglycemia. |
Hypoglycemia and effects on MACE/ Mortality | Wei et al., Front Endocrinol 2019 | Hypoglycemia was associated with increased cardiovascular death (HR 2.6) and all-cause mortality (HR 1.960). |
Underwriting Considerations
Underwriting guidance around CGM measures need to address scenarios when both GMI% and HbA1c are available. Given the current lack of well-established, long-term data on diabetic complications and mortality associated with use of CGM, use of HbA1c may be advised.
In the absence of recently available HbA1c, however, GMI% may be considered a reasonable substitute.
For cases where CGM measures such as TIR, TIH, GMI% and coefficient of variance are available, these may provide additional detail allowing for greater precision or adjustment to base ratings. For example, for those who show exceptional stability of blood glucose by TIR (e.g., > 80%), a crediting adjustment could be considered.
Reprinted with permission of ON THE RISK, Journal of the Academy of Life Underwriting (www.ontherisk.com).


