Age, gender, ethnicity, obesity, and underlying health conditions are key risk factors associated with COVID-19 mortality. However, these same risk factors are also important in all-cause mortality.
While the world’s population continues to be ravaged by the SARS-CoV-2 virus, people are still subject to anticipated all-cause mortality – the baseline level of deaths from any cause even if COVID-19 did not occur.
This paper compares how different factors influence COVID-19 mortality risk versus all-cause mortality risk (pre-pandemic) for the population of England. A better understanding of the differences in risk may help:
- governments identify vulnerable groups and improve public health policy, shielding, intervention, and resource allocation,
- researchers assess COVID-19 data quality and underreporting of COVID-19 deaths, and
- life (re)insurers better estimate risk levels in their portfolios, general-to-insured differences, selection effects, and future mortality and morbidity trends.
In this paper, the term risk amplification is used to refer to risk factors that significantly increase the risk of COVID-19 mortality above the level observed for all-cause mortality.
Key Findings:
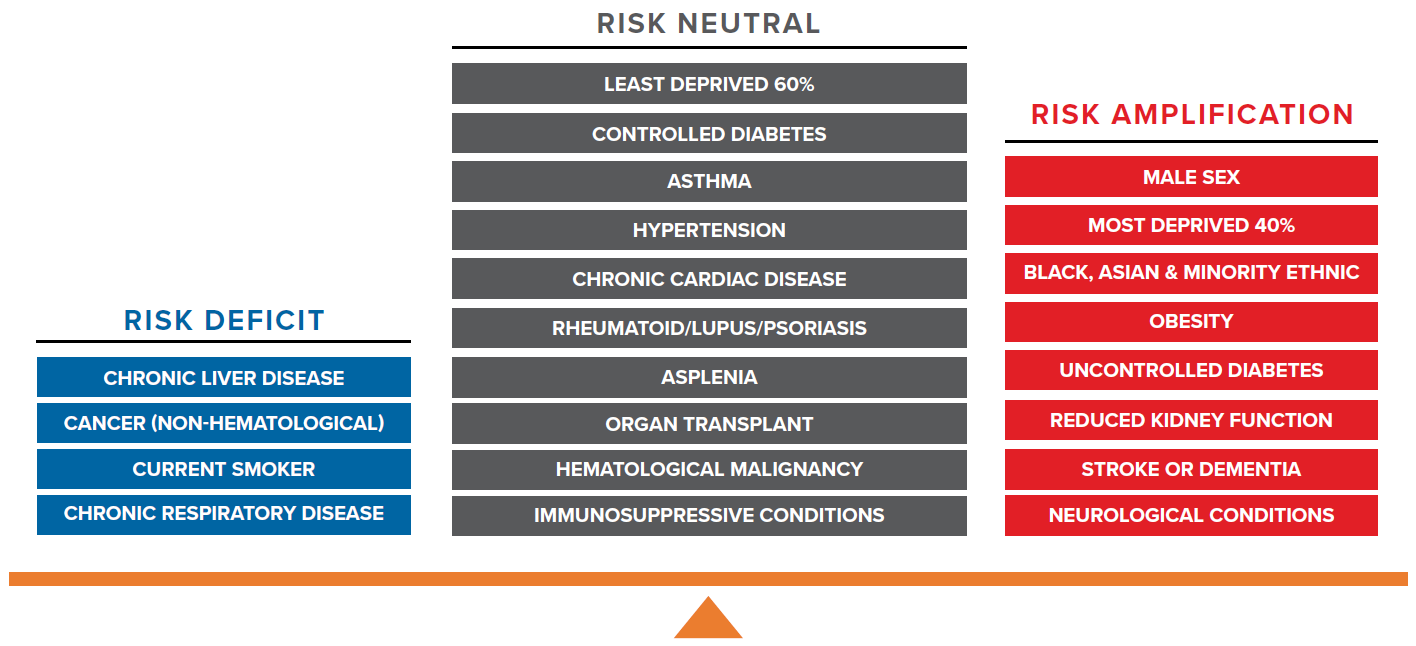
- Factors associated with COVID-19 risk amplification are male sex, deprivation, ethnicity, obesity, uncontrolled diabetes, reduced kidney function, stroke or dementia, and neurological conditions.
- The Index of Multiple Deprivation (IMD) is the official measure of relative deprivation in England; IMD aggregates information on income, employment, education, and living environment. It is well established that IMD is significantly associated with all-cause mortality risk; however, the association is more severe with COVID-19 mortality, especially in the most deprived 40%.
- U.K. data shows that Black, Asian, and minority ethnic (BAME) groups have a much higher mortality risk of COVID-19 compared to people of white ethnicity, even after adjusting for other risk factors. This stands in stark contrast to the all-cause mortality risk observed for BAME groups in the U.K. – who have actually experienced lower all-cause mortality risk compared to people of white ethnicity.
- Risk amplification according to severity was observed for biometric measures including BMI in people with obesity, HbA1c in diabetics, and eGFR in people with reduced kidney function.
- Interestingly, the majority of factors with similar or significantly lower COVID-19 mortality risk – when compared to all-cause mortality risk – were associated with immunosuppression. These include a history of cancer, current smoker status, chronic respiratory disease, and other immunosuppressive conditions. It is paradoxical to observe that an immunosuppressed patient may benefit from a protective effect or at least not experience poorer clinical outcomes.
- As with all-cause mortality, the COVID-19 mortality rate by age follows an exponential pattern in many countries, but variation exists in their gradients. The age-specific mortality pattern of COVID-19 is steeper, or more dramatically exponential, than the all-cause mortality gradient. The gap between gradients might be explained by factors associated with risk amplification, such as diabetes, reduced kidney function, obesity, stroke and dementia – risk factors known to increase in prevalence with age.
- COVID-19 relative mortality is approximately equal to the sum of all-cause relative mortality and risk amplification.
- We propose a set of two criteria, based on assessing the shape and gradient of COVID-19 mortality rates by age, which could help identify poor quality of COVID-19 death data and underreporting.
- People with high COVID-19 mortality risk, especially those with risk-amplified factors, might be considered higher priorities in terms of public health policies concerning shielding, hospital treatments, and vaccinations.
- Risk-amplified factors with high prevalence will be important for life (re)insurers to monitor closely as these could have important implications for underwriting, pricing, and future trends.
Multifactoral modeling of COVID-19 and all-cause mortality
COVID-19 mortality risk information presented here is derived from the OpenSAFELY research study.[1] This study leveraged the value of very large and detailed longitudinal National Health Service (NHS) datasets. In total, 17 million electronic health records (roughly 40% of England’s population) were used in conjunction with 10,926 COVID-19-related deaths (that occurred up to May 6, 2020) to build a multifactorial risk model of COVID-19 mortality.
Table 2.1:
Comparison of Large Studies Pertinent to COVID-19 Mortality Research in the U.K.
Table 2.1 shows a list of large studies on COVID-19 mortality in the U.K. The OpenSAFELY research was the largest cohort study and credibly quantifies a range of demographic and physiological risk factors associated with COVID-19 population fatality – the conjoint risk of infection with the SARS-CoV-2 virus and the risk of dying once infected.
General population all-cause mortality risk information was derived from a meta-analysis of mortality research studies and population characteristics, allowing us to model the normal risk of dying – from any cause – prior to the outbreak of COVID-19.[1, 5-16] This normal risk information is usually referred to as expected mortality, background mortality, or historical all-cause mortality.
For each risk factor included in the OpenSAFELY study, we compare the hazard ratio (HR)1 for COVID-19 mortality (HR COVID-19) against the HR for risk of all-cause mortality (HR all-cause). We define the following terms accordingly:
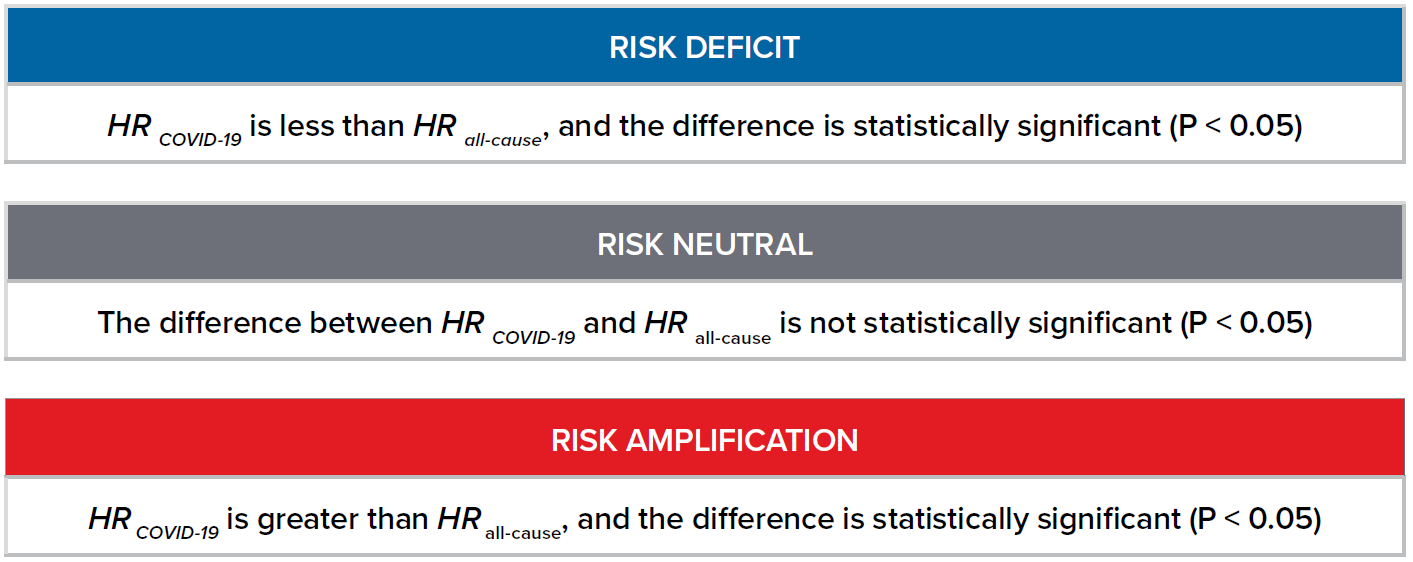
1 A hazard ratio can be defined as the ratio of (risk of outcome in one group) / (risk of outcome in another group) in a given period of time.
Figure 2.1:
Comparison of COVID-19 and All-Cause Mortality Risk
What increases COVID-19 mortality risks when compared to all-cause mortality?
3.1 Male Sex
Figure 3.1:
Comparison of Hazard Ratios for Male and Female in COVID-19 and All-Cause Mortality
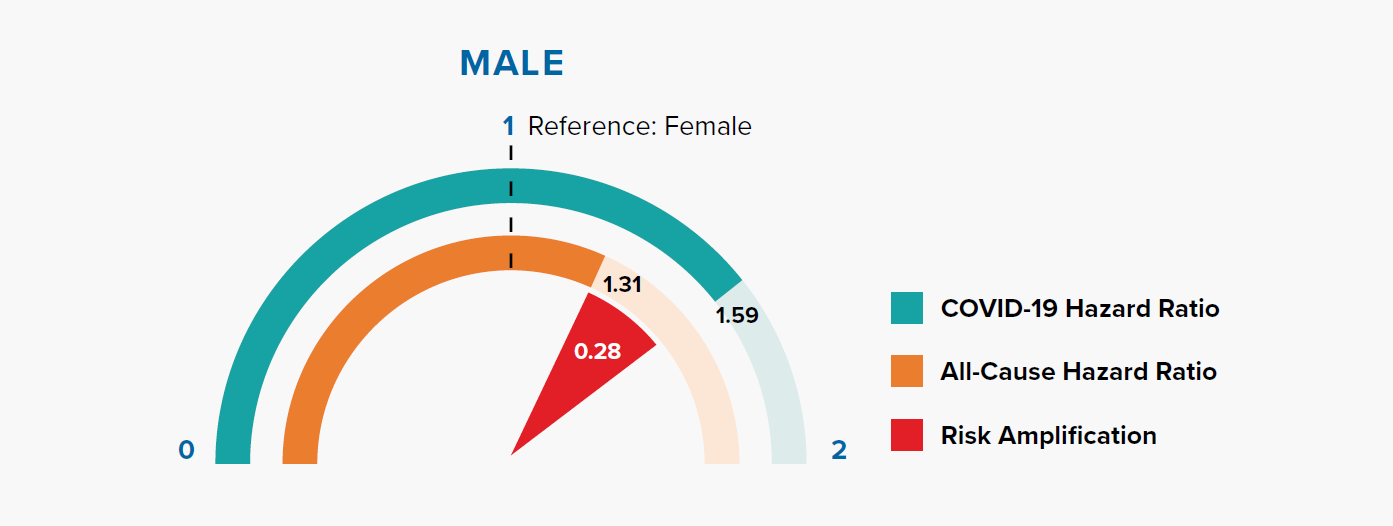
Figure 3.1 shows that the HRs for being male are 1.31 and 1.59 for all-cause mortality and COVID-19 mortality, respectively. In other words, being male is associated with a +31% risk of all-cause mortality compared to being female, but a +59% risk of COVID-19 mortality. The magnitude of risk amplification for male sex is the difference in the HRs, i.e., 1.59 – 1.31 = 0.28.
Gender is a well-recognized risk factor for COVID-19 mortality. In a previous paper, we showed that COVID-19 mortality rates were higher for men than women in nine countries, and the difference varied with age. This could be attributed to behavioral, biological, sociocultural, and genetic factors.[17]
The OpenSAFELY model results indicate that COVID-19 fatality risk remains higher in males even after adjusting for other information, most notably socioeconomic status and underlying health conditions.
COVID-19 mortality risk is the combination of infection risk and the risk of fatality after infection. Is the higher risk in men driven by infection risk? Data collated by Global Health 5050 and REACT2 studies of antibody prevalence in England showed that males have a similar infection risk as females.[18, 19] Since behavioral and sociocultural factors primarily influence the infection risk, this suggests that the reason for males’ amplified mortality risk could be biological or genetic.
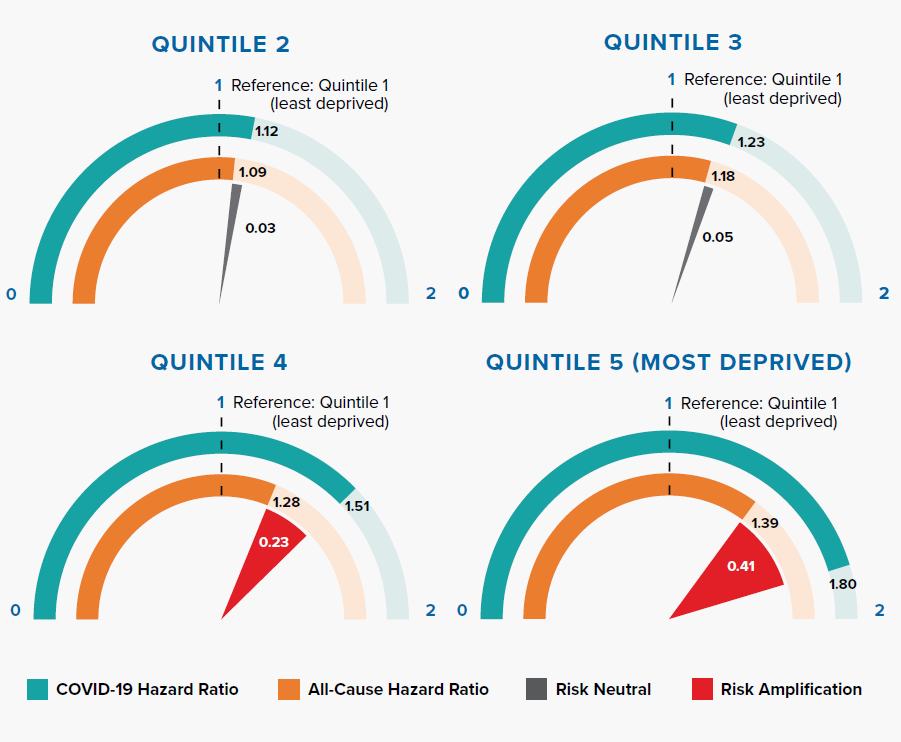
3.2 Socioeconomic status
Figure 3.2:
The Index of Multiple Deprivation (IMD) is an overall measure of deprivation encompassing multiple factors including income, employment, health, education, crime, living environment, and access to housing and services.[20, 21]
Figure 3.2 shows that the deprivation quintile is significantly associated with all-cause mortality; however, the gradient is steeper for COVID-19. In particular, the two most deprived quintiles have significantly greater risk compared to the all-cause HRs. The magnitude of risk amplification is 0.41 and 0.23 for Quintiles 5 and 4, respectively.
An Office for National Statistics (ONS) report, which investigated age-standardized mortality rates in England between March 1 and June 30, 2020, concluded that COVID-19 has had a proportionally higher impact in the most deprived areas when compared with all-cause deaths.[21] The OpenSAFELY research study shows that the effect remains significant even after adjusting for other risk factors such as age, gender, and underlying health conditions.
As with many other diseases, there is evidence of a striking socioeconomic gradient for COVID-19 mortality risk, and the effects on the most deprived groups are significantly exacerbated. This widening mortality inequality could be due to a range of reasons, including larger households, higher population density, geographical proximity to infections, occupational types (social care, healthcare, manufacturing, retail), and greater use of public transportation leading to higher infection rates.[22, 23]
3.3 Ethnicity
Figure 3.3:
Comparison of Hazard Ratios for White, Black, Asian, Mixed, and Other Ethnicities in COVID-19 and All-Cause Mortality
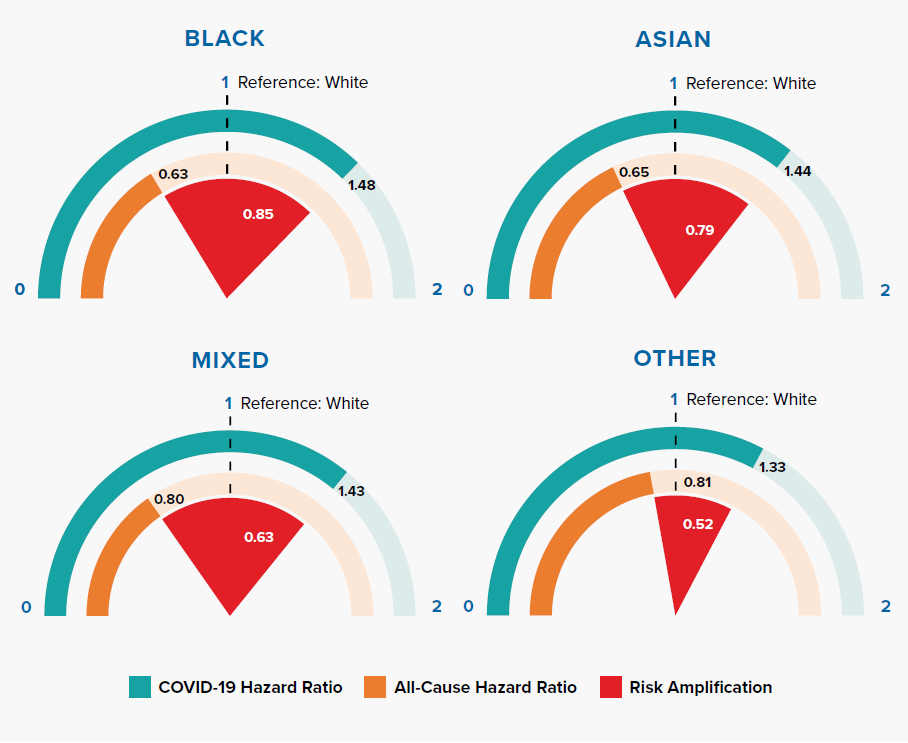
Figure 3.3 shows that Black, Asian, and minority ethnic (BAME) groups have a much higher COVID-19 mortality risk compared to people of white ethnicity. Researchers have suggested that this could be due to a combination of reasons: occupation types, housing density, multifamily or multigenerational households, location, poverty, underlying health conditions, additional psychological distress, vitamin D deficiency, biological factors, lack of access to health services, and effectiveness of communications about COVID-19 risk.[24, 25] The OpenSAFELY results demonstrate an increased risk in BAME groups after controlling for differences in socioeconomic status and comorbidities, implying that other factors are important.
A striking observation from our comparison against all-cause mortality risk is that COVID-19 risk in BAME groups is greatly amplified from what we see for all-cause mortality in England, where BAME groups have lower mortality than the white population. Other researchers have attributed this to the “healthy migrant selection effect,” which states that migrants self-select by good health into migration, resulting in a unique sub-population with a low mortality risk.[26]
Even during the pandemic, hazard ratios for deaths not attributed to COVID-19 continue to be lower for BAME groups compared to the white population, as shown in Table 3.1.
Table 3.1: Comparison of Hazard Ratios of Ethnicities in OpenSAFELY’s COVID-19 and Non-COVID-19-Related Death, Adjusting for Age, Sex, Index of Multiple Deprivation, Comorbidities, and General Practitioner Consults
3.4 Obesity
Figure 3.4:
Comparison of Hazard Ratios for Non-Obese (<30 kg/m2), Obesity Class I (30-34.9 kg/m2), Obesity Class II (35-39.9 kg/m2), and Obesity Class III (≥40 kg/m2) in COVID-19 and All-Cause Mortality
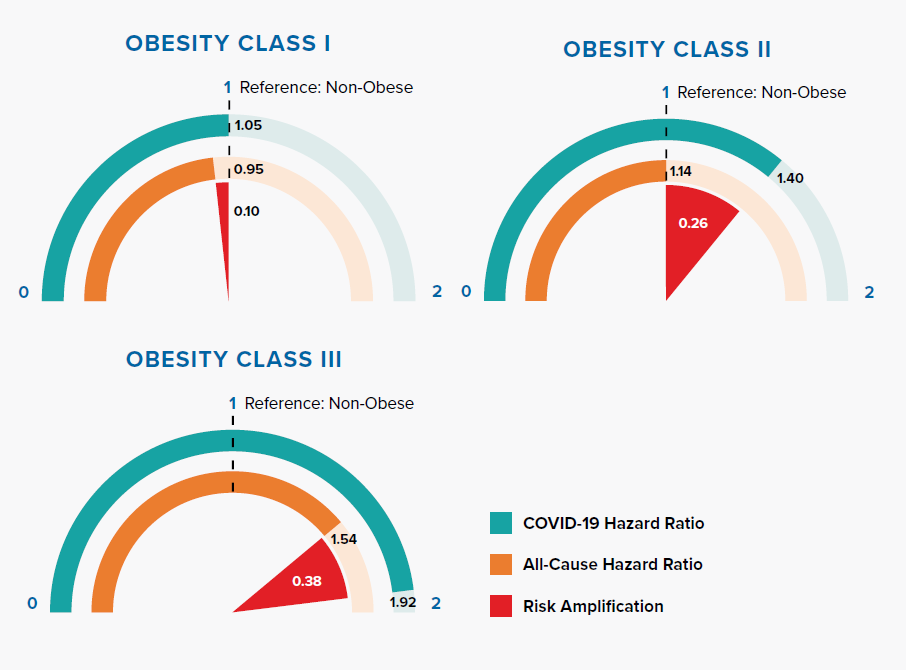
Figure 3.4 displays how risk amplification increases with higher obesity classes.
Obesity, represented by raised body mass index (BMI), is an important risk factor of all-cause mortality, as well as COVID-19 mortality. Some suggest that having more adipose tissue, or fat, could mean having more angiotensin-converting enzyme 2 (ACE2) receptors, leading to higher risk of SARS-CoV-2 infection.[28] The amplification of COVID-19 risk associated with BMI class has important implications – 29% of adults in England are obese and 36% overweight. Additionally, the prevalence of obesity increases with age.[29]
3.5 Diabetes
Figure 3.5:
Comparison of Hazard Ratios for No Diabetes, Controlled Diabetes (HbA1c <58 mmol/mol or 7.5%) and Uncontrolled Diabetes (HbA1c ≥58 mmol/mol or 7.5%)
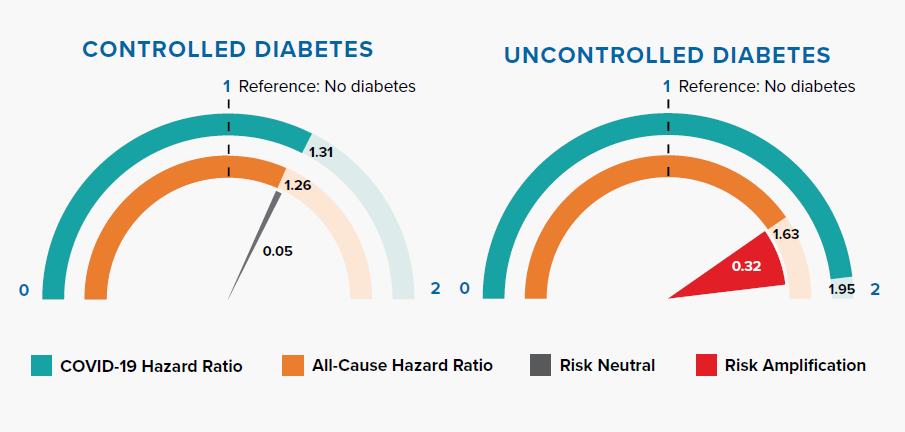
Diabetes increases COVID-19 and all-cause mortality risk. Controlled diabetes poses similar risk for COVID-19 and all-cause mortality. However, mortality risk is greatly amplified when the condition is uncontrolled.
Research published in The Lancet has shown that SARS-CoV-2 might represent an exacerbating feature for people with diabetes as it can accelerate acute metabolic problems through direct negative effects on pancreatic β-cell function. These effects on β-cell function may also cause diabetic ketoacidosis in individuals with diabetes, hyperglycemia at hospital admission in individuals with unknown history of diabetes, and potentially new-onset diabetes.[30, 31, 32]
3.6 Reduced kidney function
Figure 3.6:
Comparison of Hazard Ratios for Normal and Reduced Kidney Function in COVID-19 and All-Cause Mortality
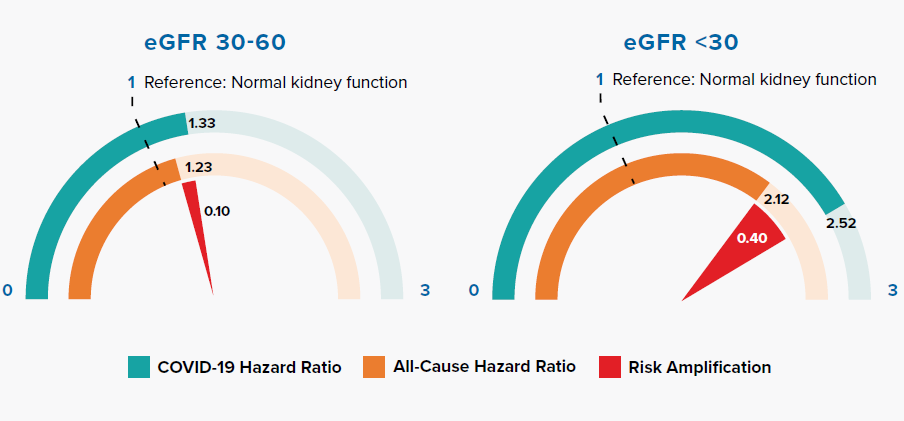
Reduced kidney function is measured by lower estimated glomerular filtration rate (eGFR). Figure 3.6 shows that COVID-19 amplifies risk in accordance with the severity of reduced kidney function.
Patients with reduced kidney function have an increased risk for infections and infection-related mortality. Alterations in the function of neutrophils, natural killer cells, macrophages, and T- and B-lymphocytes, along with chronic inflammation, lead to impaired host immunity.[33] Increased oxidative stress, uremic toxin accumulation, and endothelial dysfunction are also contributing factors.[34] Infections are second only to sepsis as the most common cause of death for patients on dialysis, with some studies finding a several-hundred-fold higher annual mortality rate as compared to that of the general population. The susceptibility to both bacterial and viral infections is highly applicable to mortality outcomes in patients with reduced kidney function who are infected with SARS-CoV-2.[33]
3.7 Stroke or dementia
Figure 3.7 Comparison of Hazard Ratios for Stroke or Dementia Versus None in COVID-19 and All-Cause Mortality
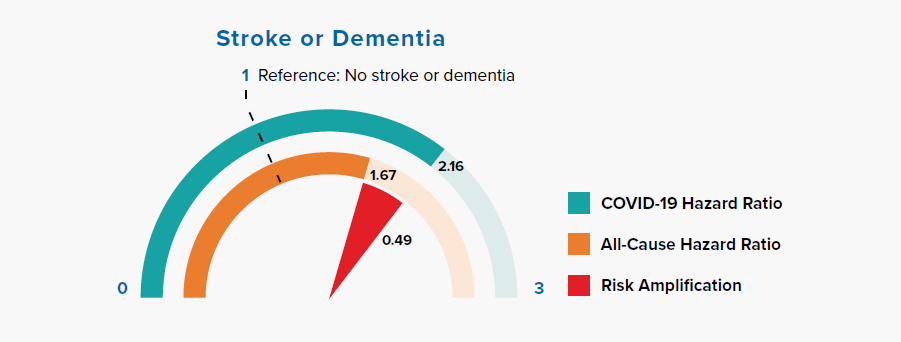
Chronic neurological conditions were separated into diseases with a likely cardiovascular etiology (stroke or dementia) and other conditions. Figure 3.7 shows that people with a history of stroke or dementia were at greater risk of COVID-19 mortality, as compared to the all-cause mortality HR.
A paper published in Stroke found that stroke patients had abnormal laboratory markers on admission, including elevated levels of white blood cells, neutrophils, C-reactive protein, procalcitonin, D-dimer, blood urea nitrogen, creatinine, and creatine kinase-MB, and lower lymphocyte and platelet counts, compared to patients without stroke.
This result suggests that cytokine cascade, excessive inflammatory reaction, coagulation dysfunction, and organ injury might aggravate the stroke patients’ prognosis and lead to mortality owing to SARS-CoV-2 infection.[35]\
3.8 Other neurological conditions
Figure 3.8:
Comparison of Hazard Ratios for Other Neurological Conditions Versus None in COVID-19 and All-Cause Mortality
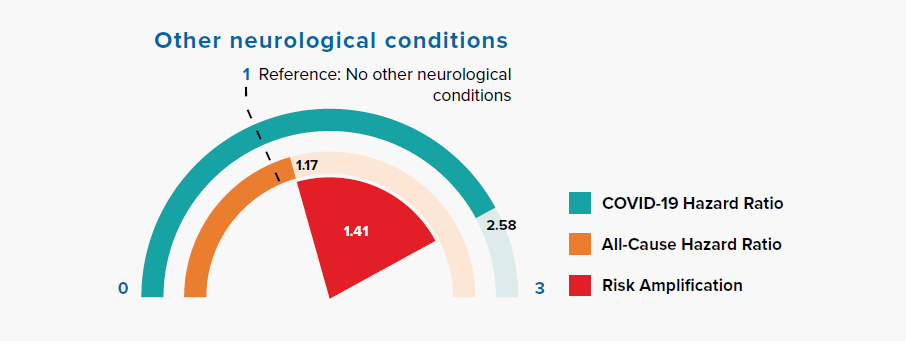
Figure 3.8 shows a large risk amplification for COVID-19 in people with a history of other neurological conditions, including motor neuron disease, myasthenia gravis, multiple sclerosis, Parkinson’s disease, cerebral palsy, quadriplegia or hemiplegia, and progressive cerebellar disease.
Association of neutral and deficit risk factors with immunosuppression
4.1 Risk neutral factors
Risk neutral factors include asthma, hypertension, chronic cardiac disease, rheumatoid arthritis/lupus/psoriasis, asplenia, organ transplant, hematological malignancy, immunosuppressive conditions, controlled diabetes, and the least deprived 60% (measured by IMD) of population.
Asthma and hypertension have HRs close to 1 in both COVID-19 and all-cause mortality models. Interestingly, COVID-19 mortality does not seem to be exacerbated drastically by pre-existing respiratory conditions, such as asthma, and the HR is not very different from that seen for all-cause mortality.
4.2 Risk deficit factors
Risk deficit factors include cancer (non-hematological), chronic liver disease, current smoker status, and chronic respiratory disease.
In the OpenSAFELY paper, Williamson et al. explained that the low hazard ratio (HR) of 0.89 for current smokers cannot be interpreted causally, i.e., protective, as it is associated with other factors such as chronic respiratory disease.[1] Nevertheless, we find that both current smoker and chronic respiratory disease have hazard ratios much
lower than those observed for all-cause mortality despite adjustments for confounders including age, sex, deprivation, ethnicity, and underlying health conditions. This suggests association alone is not sufficient in explaining the deficit in relative risks. Particularly, the HR for current smoker status in COVID-19 is less than half of that observed in an all-cause mortality model.
Reasons that might explain a risk deficit for people with a history of cancer and chronic liver disease include shielding (adherence of government guidelines), strong support system during the pandemic, avoidance of social contacts, reduced visits to hospitals with higher infection risks, and the use of immunomodulatory drugs. A U.K. Biobank study showed a relatively low cancer hazard ratio of 1.4 for COVID-19 and, similarly, flu and pneumonia’s cancer hazard ratios to be around 1.7.[36]
4.3 Is immunosuppression a friend or foe?
In our analysis we observe that a majority of risk neutral and risk deficit factors, including asthma, chronic respiratory disease, rheumatoid arthritis, lupus, psoriasis, asplenia, organ transplant, immunosuppressive conditions, cancer, and chronic liver disease, could involve immunosuppressive treatment such as corticosteroids. Smoking, one of the risk deficit factors, is also associated with suppression of the immune system.[37, 38]
Immunosuppression has been observed to have both positive and negative impacts on COVID-19 mortality. For example, a recent U.K. case study series reported significantly higher case fatality rates in hematology patients receiving immunosuppressive or cytotoxic therapy within three months of COVID-19 diagnosis.[39]
An understanding of immunosuppression cannot be complete without discussing the role of corticosteroids in COVID-19 disease. An observational study has shown that the use of intensive immunosuppressive treatment in conjunction with high-dose glucocorticoids reduces hospital mortality by 65% in patients with COVID-19-associated cytokine storm syndrome. Similarly, the U.K. Randomised Evaluation of COVID-19 Therapy (RECOVERY) trial, which compares a range of possible treatments with usual care in patients hospitalized with COVID-19, has also shown benefits with steroids. A pilot report found that dexamethasone reduced deaths by 33% in patients receiving invasive mechanical ventilation and by 20% in patients receiving oxygen without invasive mechanical ventilation.[40]
As it stands, reassuring initial data suggests that immunosuppressants, with the exception of high-dose corticosteroids, have a role in treatment of COVID-19 disease and that by extension, the immunosuppressed patient may paradoxically benefit from a protective effect or at least not be subject to a poorer clinical outcome as conventional wisdom might suggest.[41]
Factors that amplify COVID-19 risk could explain variation in age-specific mortality patterns
In most countries, including the U.K. and U.S., the risk of dying for adults follows an exponential pattern with age – this is true for both COVID-19 mortality and all-cause mortality. The increase in risk with age, known as the age gradient, can be modeled using the Gompertz function:
m(t) = Aeαt
where α enables the derivation of the mortality rate doubling time (MRDT) – the age increment necessary for mortality rate to double. The greater the α, the shorter the MRDT, and the steeper the age gradient. We previously studied mortality data from nine countries and concluded that the age gradient of COVID-19 fatality is steeper than that of general population all-cause mortality. We also observed that the U.S. has the longest MRDT, or flattest age gradient, for COVID-19 mortality.[42] In other words, the U.S.’s COVID-19 death toll skews younger, a phenomenon also reported in The Economist article, “When covid-19 are analysed by age, America is an outlier”:[43]
“People in their 40s, 50s and 60s, meanwhile, account for a
significantly larger share of those who die.
The median covid-19 sufferer in America
is a 48-year-old; in Italy it is a 63-year-old.”
“Another reason, perhaps, is that middle-aged Americans
may be less healthy than their European peers,
eg, because they tend to be more obese.”
Age is the most important factor for increasing a person’s COVID-19 mortality risk, but do other risk factors help explain its functional relationship with mortality? A likely reason for the U.S.’s relatively flat COVID-19 age gradient is its general population all-cause mortality curve already being one of the flattest to begin with. The research presented so far demonstrates that many risk factors for all-cause mortality also seem to drive COVID-19 mortality. For example, a higher prevalence of obesity in a younger population could increase COVID-19 mortality rates in younger people, hence dampening the age gradients for both COVID-19 and all-cause mortality. To further explore the association of age with COVID-19 and all-cause mortality risk, we calculated age-stratified mortality rates for England, Wales, and the U.S.:
- COVID-19 population fatality rates for England and Wales were calculated from death (as of May 15) and population data from ONS.[44, 45]
- Historical all-cause mortality rates for England and Wales were derived from five-year-average death counts in England and Wales from 2015 to 2019 and ONS population data.[44, 45]
- COVID-19 population fatality rates for the U.S. were calculated using death data from the Centers for Disease Control and Prevention (CDC) and populatiwhon data from the United Nations.[46, 47]
- Historical all-cause mortality rates for the U.S. were extracted from the Human Mortality Database.[48]
These mortality rates were then converted to mortality ratios using the mortality rates for ages 50 to 59 years as the reference group; results are shown in Figure 5.1.
Figure 5.1:
Mortality Ratios by Age for COVID-19 and All-Cause Mortality in England, Wales, and the U.S.; Age Group 50-59 Is the Referent (Mortality Ratio Equals to 1)
Figure 5.1 suggests that the age gradient of COVID-19 mortality somewhat mirrors the age gradient of general population all-cause mortality for the given countries; however, the COVID-19 age gradient is slightly steeper in both examples. Could other risk amplification factors help explain the differences in gradients?
Figure 5.2 also shows COVID-19 mortality ratios for age, but uses the univariate statistics reported in the OpenSAFELY study.[1] The resulting mortality ratios are very consistent with the ONS results in Figure 5.1. The age gradient for COVID-19 mortality is, again, clearly steeper than that of all-cause mortality, with MRDTs equal to 6.4 and
7.7 years, respectively.
Figure 5.2
Univariate Mortality Ratios by Age for COVID-19 (Taken from OpenSAFELY) and All-Cause Mortality in England, on Linear (A) and Logarithmic (B) Scales
Figure 5.3 again shows COVID-19 mortality ratios for age, now using statistics reported in the OpenSAFELY study after adjustment for other risk factors (i.e., the multivariable model that includes gender, obesity, deprivation, and underlying health conditions). It is very interesting to observe that the mortality relationships with age for COVID-19 and all-cause mortality now overlap almost exactly for age groups 60-69 and 70-79. This implies the difference in the age slope of COVID-19 and all-cause mortality rates might be largely explained by the risk factors described in Section 3.
Figure 5.3:
Figure 5.3 Adjusted Mortality Ratios by Age for COVID-19 (Taken from OpenSAFELY) and All-Cause Mortality in England, on Linear (A) and Logarithmic (B) Scales
The COVID-19 mortality ratio for the 80-plus age group, however, remains higher than the all-cause mortality ratio. It is possible that nursing home deaths explain the difference. A University of Cambridge study, removing deaths from the nursing home population in England, found that the log-linear relationship between age and risk of death continued into older age groups. The log-linear relationship could be generalized to other countries by removing nursing home deaths.[49]
As an example, a healthy, white, 80-year-old female has roughly 150 times the risk of dying – from any cause – compared to a 20-year-old white woman in good health, and the difference in risk is similar for COVID-19 mortality. On the other hand, the risk of dying for an average 80-year-old person in the general population compared to an average 20-year-old person is about 220 times for all-cause mortality and 700 times for COVID-19 mortality, due to the higher prevalence of underlying health conditions in average 80-year-olds compared to average 20-year-olds that amplify the risk for COVID-19.
In conclusion, risk factors that amplify COVID-19 mortality may help explain the age gradient of mortality in COVID-19. We observe that diabetes, reduced kidney function, obesity, stroke, and dementia are all associated with COVID-19 risk amplification, and these conditions are known to increase in prevalence with age.[50, 51] Thus, COVID-19 relative mortality can be approximated as follows:

Implications
6.1 Public health policies
Multivariable models, built using large demographic and medical data, such as those derived in the OpenSAFELY and QCOVID studies, can help to clarify various risk drivers for COVID-19 mortality, address confounding factors, and predict risks more accurately.[1,3] Those at high COVID-19 mortality risk, especially those affected by risk-amplified factors, could be considered as higher priorities in terms of public health policies concerning shielding and hospital treatments, as well as clinical trials of pharmacotherapies and vaccinations. When we have a safe and effective vaccine or vaccines, these people might also be considered as high prioritization groups for inoculation. Our recent white paper discusses COVID-19 vaccination scenarios in more detail.[52]
Table 6.1:
OpenSAFELY: Comparison of Risk-Amplified Factors1
ⱡ among non-missing values
All factors in Table 6.1 exhibit risk amplification: some have higher prevalence than others in the general population, and these factors deserve the most attention. They include being male, being obese, having diabetes, living in areas of high deprivation, and belonging to a BAME ethnicity group. Of these risk factors, obesity and glucose control in diabetics are modifiable.[36]
The large amplification of COVID-19 mortality risk for BAME groups, as compared to all-cause mortality risk, adds to the concern that COVID-19 is having a disproportionate impact on individuals from BAME groups.[53] Population statistics from GOV.UK indicate that the U.K. has a large and diverse BAME population, accounting for 14% of the total
population in England and Wales.[54] There is an urgent need for action and policies to help to reduce inequalities in experience by ethnicity, such as those outlined by Mamluk et al.[25] Unfortunately, COVID-19 mortality risk inequality is also observed in people living in deprived areas, and the risk is amplified when compared to all-cause mortality.
6.2 Assessing COVID-19 data quality and underreporting
The results presented in this paper may help in validating the quality of country-specific COVID-19 death data by checking two criteria:
I. COVID-19 mortality rates by age are expected to follow a log-linear relationship, especially in people aged 30 to 70 years old.
II. The age gradient for COVID-19 is steeper than the age gradient of general population all-cause mortality.
The above benchmarks appear to hold true for European, North American, and some Asian countries, including South Korea.[42] However, we fail to observe a log-linear relationship for COVID-19 death data from countries, such as Mexico and India, where the age gradients are surprisingly flat at older ages.[47, 55, 56] This might be explained by underreporting of COVID-19 deaths, especially at older ages. A study from the University of Cambridge from 45 countries with 22 seroprevalence surveys suggests that some countries in Asia and South America have far fewer reported COVID-19
deaths in older people than expected based on infection estimates and total excess deaths observed this year; this could be due to underreporting as countries struggle to contain the pandemic.[49]
Such analyses might help researchers and institutions better measure and monitor the true death toll of the pandemic.
6.3 Understanding the impact on life (re)insurers
For underwriters and actuaries, it is perhaps more practical – given limited data – to consider broad-brush drivers, such as risk factors with high prevalence and a large risk amplification with reference to the age-sex-adjusted hazard ratios shown in Figure 5.1. Thus, the most material factors to monitor closely, in addition to age and sex, appear to be obesity (HR up to 2.66), diabetes (HR up to 2.61), and reduced kidney function (HR up to 3.48).
Insured populations tend to have a different age and gender mix than the general population. People with life insurance tend to be more affluent and, having been approved for coverage via underwriting, may also have fewer comorbidities, so the elevated risks observed for COVID-19 in the general population are likely to be lower in an insured population. These considerations can help pension funds and insurers assess liabilities.
Since COVID-19 mortality risk is highest in older people with underlying health problems, we must also ask: To what extent has there been an “acceleration” of deaths? In other words, had the COVID-19 pandemic never happened, how many deaths would have occurred within the next few years?
Mortality displacement and significant risk differentials could result in selection effects and a change in mix in the population. For example, the 1918 influenza pandemic had a strong and fairly long-lasting effect in diminishing the mortality differential by sex in the United States.[57] Direct impacts from risk-amplified factors in COVID-19 might have
longer-term longevity and morbidity implications. Other direct impacts include government interventions, as well as availability of vaccines. Future trends could be negatively influenced by indirect impacts such as mental health deterioration, rising unemployment rates, “long COVID” (recurrent or persisting symptoms after infection), and delayed cancer screening and interventions. However, future trends could also involve positive uncertainties, including increased adoption of vaccination, hand hygiene, and leveraging of research into other causes of death such as flu and cancer. A holistic and probabilistic assessment is recommended to estimate excess deaths and the trends of possible scenarios in the coming months and years.