In the U.K., the Continuous Mortality Investigation (CMI) produces annual updates to its mortality projection model to reflect emerging mortality data and trends.
The CMI Mortality Projections Committee (MPC) has recently released a proposal for consultation regarding the parameterisation1 of the next iteration of the model (known as CMI_2023), which runs until March 11, 2024. RGA explores the practical implications of the proposed approach.
Key takeaways
1. The proposed parameterisation of CMI_2023 results in relatively small impacts to expectations of life relative to the earlier version (CMI_2022), but these should be considered in the context of the large impacts introduced in CMI_2022.
Relative to pre-pandemic expectations, the CMI_2022 core parameterisation led to a fall in life expectancy at age 65 of around six months, equivalent to around 2.5%. This is a large change, and one that followed substantial reductions between CMI_2014 and CMI_2018. Users should consider carefully whether enough evidence exists to support these changes, alongside the consideration of the changes made between CMI_2022 and CMI_2023.
2. The proposed CMI_2023 core parameterisation implies low short- to medium-term future improvements.
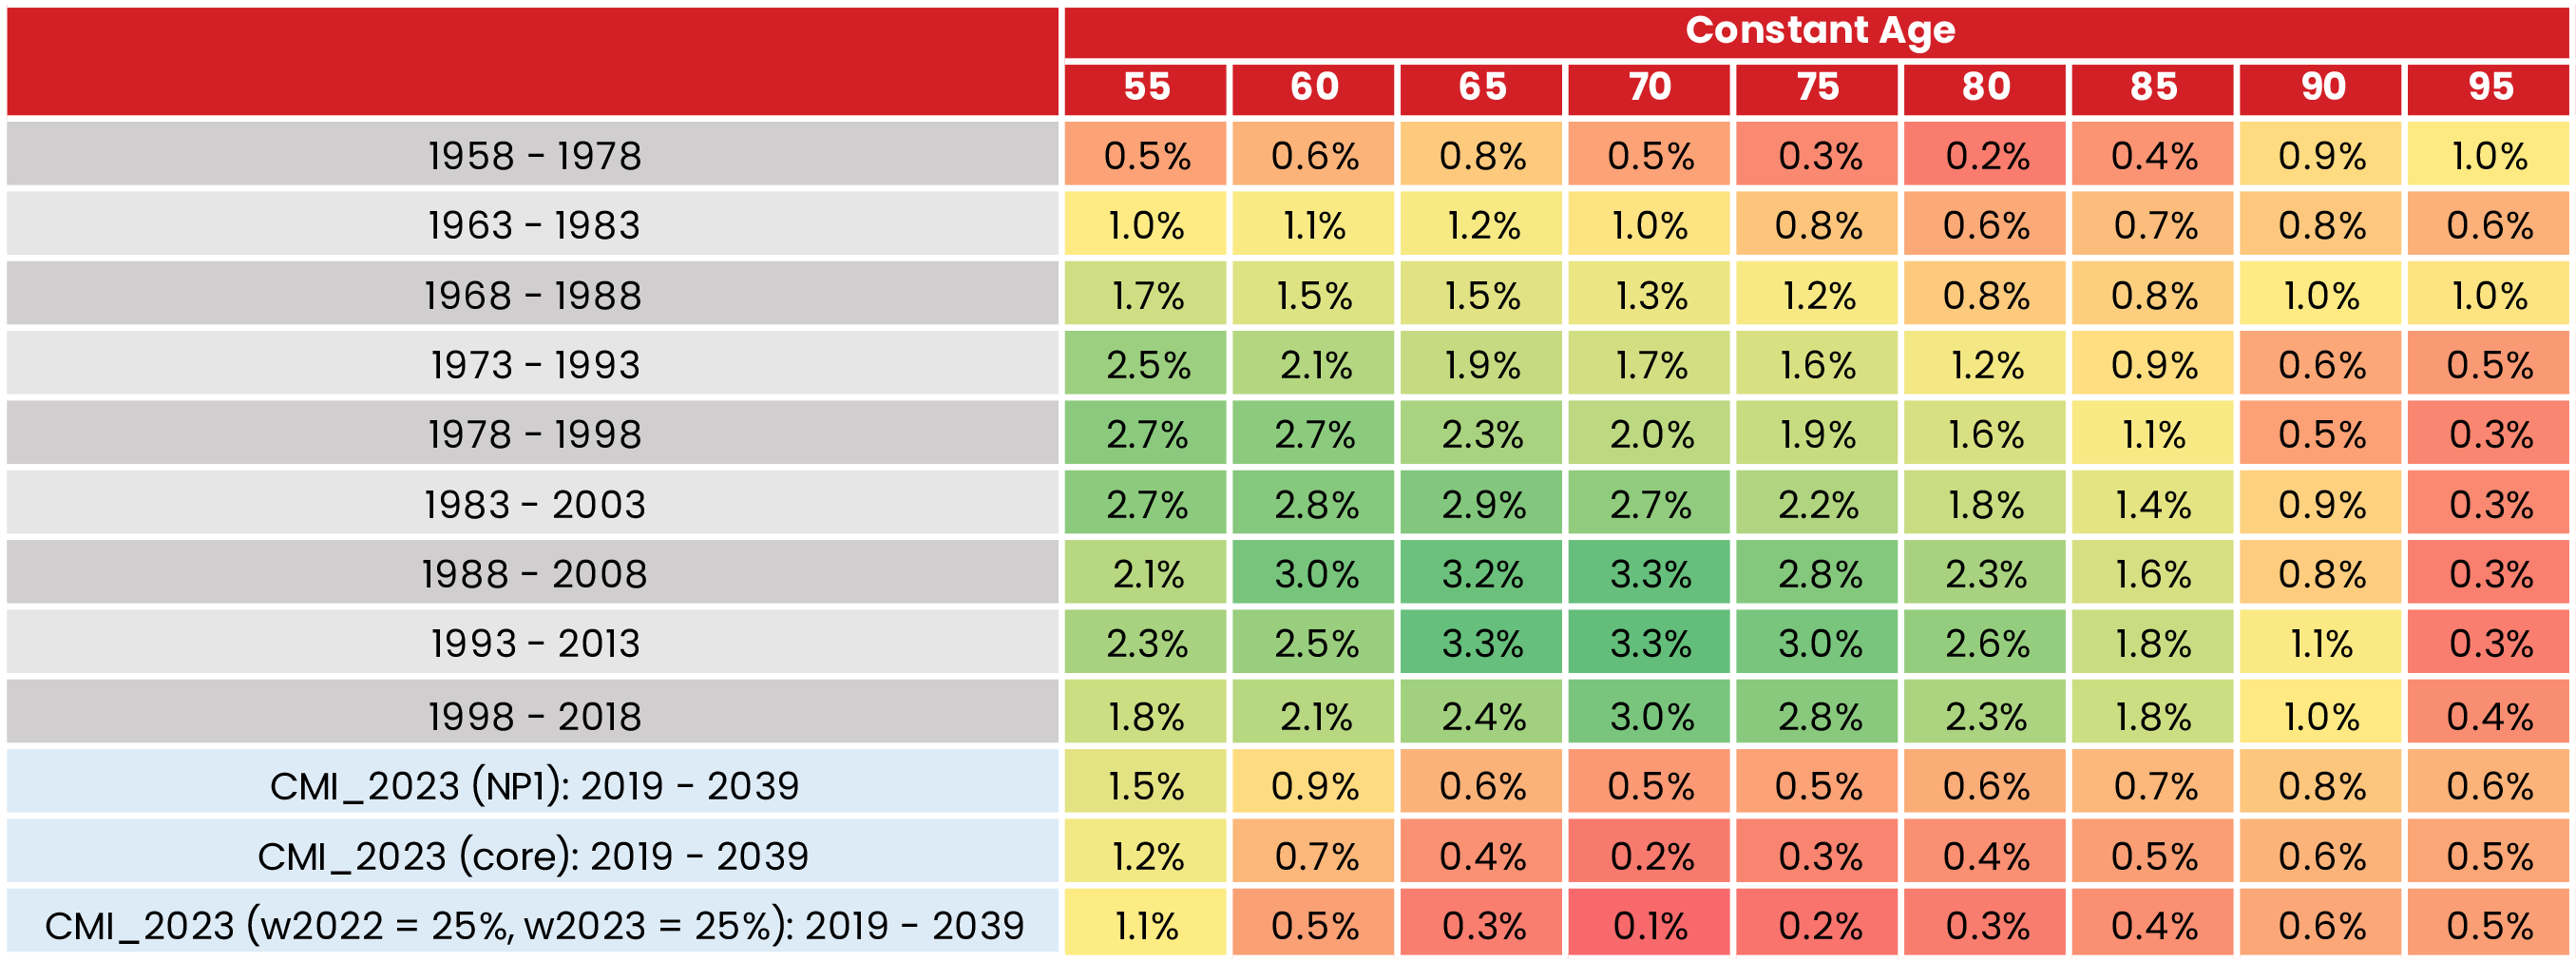
The table below illustrates that the proposed CMI_2023 core parametrisation yields future improvements over the period 2019-2039 comparable to the lowest seen in any historical 20-year period since 1958. The difference is even larger when assuming a 25% weight to 2022 and 2023 data (which was one of the options considered by the MPC). The NP1 projection (which applies no weight to years 2020-2023) implies historically low mortality improvement rates over the next 20 years, and it is arguable that this is already reflective of a post-pandemic environment of low mortality improvements. Please see the complete paper for more details of the analysis.
Table 1: Average annualised England and Wales mortality improvement produced by the proposed CMI_2023 model for 2019-2039 against historic 20-year periods for constant age – male
3. The proposed CMI_2023 core parameterisation implies significant permanent levels of excess mortality relative to pre-pandemic expectations.
We have expressed current excess mortality relative to a pre-pandemic view2 and calculate the excess that must remain after 10 years if it was to evolve linearly from present day and give the same expectations of life as the proposed CMI model. At ages 60+, significant amounts of the initial excess must remain at year 10 to achieve the same expectations of life as the CMI_2023 proposed core parameterisation. The excess would even increase under a 25% weight to both 2022 and 2023 data. The analysis focused on males – please see the complete paper for more details of the analysis.
Table 2: Equivalent residual excess mortality analysis for 10% and 25% weighting schemes – males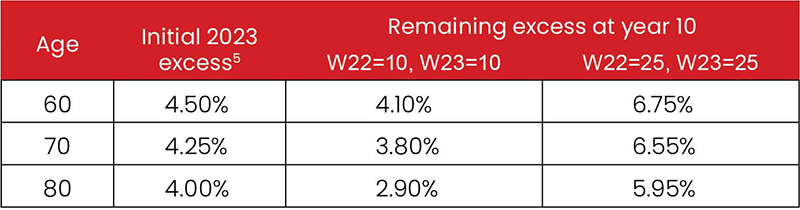
4. The decision to adopt significant reductions to life expectancies relative to pre-pandemic expectations should be taken with great care, and consideration should be given to other approaches (for example, a driver-based approach).
We should not take lightly the decision to adopt a parameterisation that implies a significantly lower life expectancy than pre-pandemic expectations, particularly with limited evidence available to form a view of the post-pandemic mortality trajectory. An important part of assessing the reasonableness of the proposed calibration would be for users to analyse the drivers of excess mortality and form a view on how these will evolve in the future. When this view is expressed as a parametrisation of the CMI_2023 model, 10% should not be considered a lower bound for the weights.
Mortality improvements are notoriously hard to predict, and we recognise that others will have a different outlook than ours. We look forward to the discussions that arise as part of the CMI_2023 consultation and are grateful for the work the CMI Mortality Projections Committee does on behalf of the actuarial profession at a time of great uncertainty.
RGA is equipped with both the technical expertise and financial security to manage post-pandemic mortality risks. Contact us to find out more about our reinsurance and de-risking solutions.