For many years, underwriters have used HbA1c tests to assess blood sugar control in people with an established diagnosis of diabetes.
The test, which measures how much hemoglobin in the blood is bound to glucose over time, is also used to detect non-disclosure of diabetes or undiagnosed diabetes.
More recently, underwriters have begun looking at whether HbA1c test results could also be used to refine mortality risk assessment for people with pre-diabetes and even to fine-tune mortality risk assessment for people in good health. With HbA1c testing on the rise, an increasing number of underwriters are starting to look more closely at the mortality implications of its results.
Sweet Memories
The A1c component of hemoglobin and its relationship with diabetes was first discovered in the late 1960s, and using it as a diagnostic test for diabetes came into clinical practice during the 1970s and 1980s. Since then, the HbA1c test has become the gold standard for monitoring glycemic control in people with diabetes. Unlike blood glucose testing, which simply measures the concentration of glucose in the blood when the test is administered, the HbA1c metric reflects average blood glucose levels during the last 2 to 3 months. The HbA1c test has an advantage over traditional glucose testing as fasting is not required and the results are not subject to day-to-day fluctuations.
Laboratory tests for applicant assessment were increasingly used by U.S. life insurers through the 1990s, and HbA1c was gradually added to the underwriter’s armory. It was primarily used as a reflex test for applicants with raised fructosamine levels, evidence of urinary glucose, hyperglycemia or a history of diabetes.
Then, an important 2007 study reported the existence of a relationship of HbA1c and 5-year all-cause mortality.1 The study, which examined mortality among 286,443 non-smoking US insurance applicants, found even small elevations of HbA1c above 5.9% can be associated with significant levels of excess mortality. Interestingly, the study also reported increased mortality for those with HbA1c values below 5%. (It should be noted that the study was unable to make a distinction between diagnosed and undiagnosed diabetes and mortality results, therefore, included people with diabetes.)
In recent years, substantial research effort has been devoted to determining the relationship of HbA1c with all-cause mortality. Studies published since 2007 have added greatly to our understanding of the importance of HbA1c levels, particularly for people without diabetes.
Our analysis assessed the relationship between HbA1c and all-cause mortality using data from the Centers for Disease Control and Prevention’s (CDC) National Health and Nutritional Examination Surveys (NHANES 1988-2015). The analysis covered 59,424 individuals spanning the ages of 18 to 89. Of these, 5,840 (10%) said they had previously been told by doctors they had diabetes at baseline. During a total of 671,232 person-years of follow-up (range: < 1 year to 27 years; average 11 years), 11,569 deaths were recorded. Hazard ratios (HRs) were derived from Cox proportional hazards models for survival time outcomes (Cox survival models), with adjustments for age, sex, smoker status, blood pressure, cholesterol, body-mass index (BMI) and disease history.
Before we review the current literature, let’s recap the different ways in which HbA1c is measured and how the measurement can be used to diagnose diabetes.
Measure for Measure
In the US, HbA1c values are reported as percentages using the National Glycohemoglobin Standardization Program (NGSP) scale. Many other countries are gradually switching to reporting HbA1c in mmol/mol, usually referred to as IFCC (International Federation of Clinical Chemistry) units.
Table 1 shows a conversion scale for the two types of units. To convert from NGSP percentage to IFCC units, the formula2 is (10.93 x NGSP %) - 23.50. Table 1 also provides a conversion scale for HbA1c units and their equivalent estimated average glucose value (eAG), which allows the two test results to be compared.3
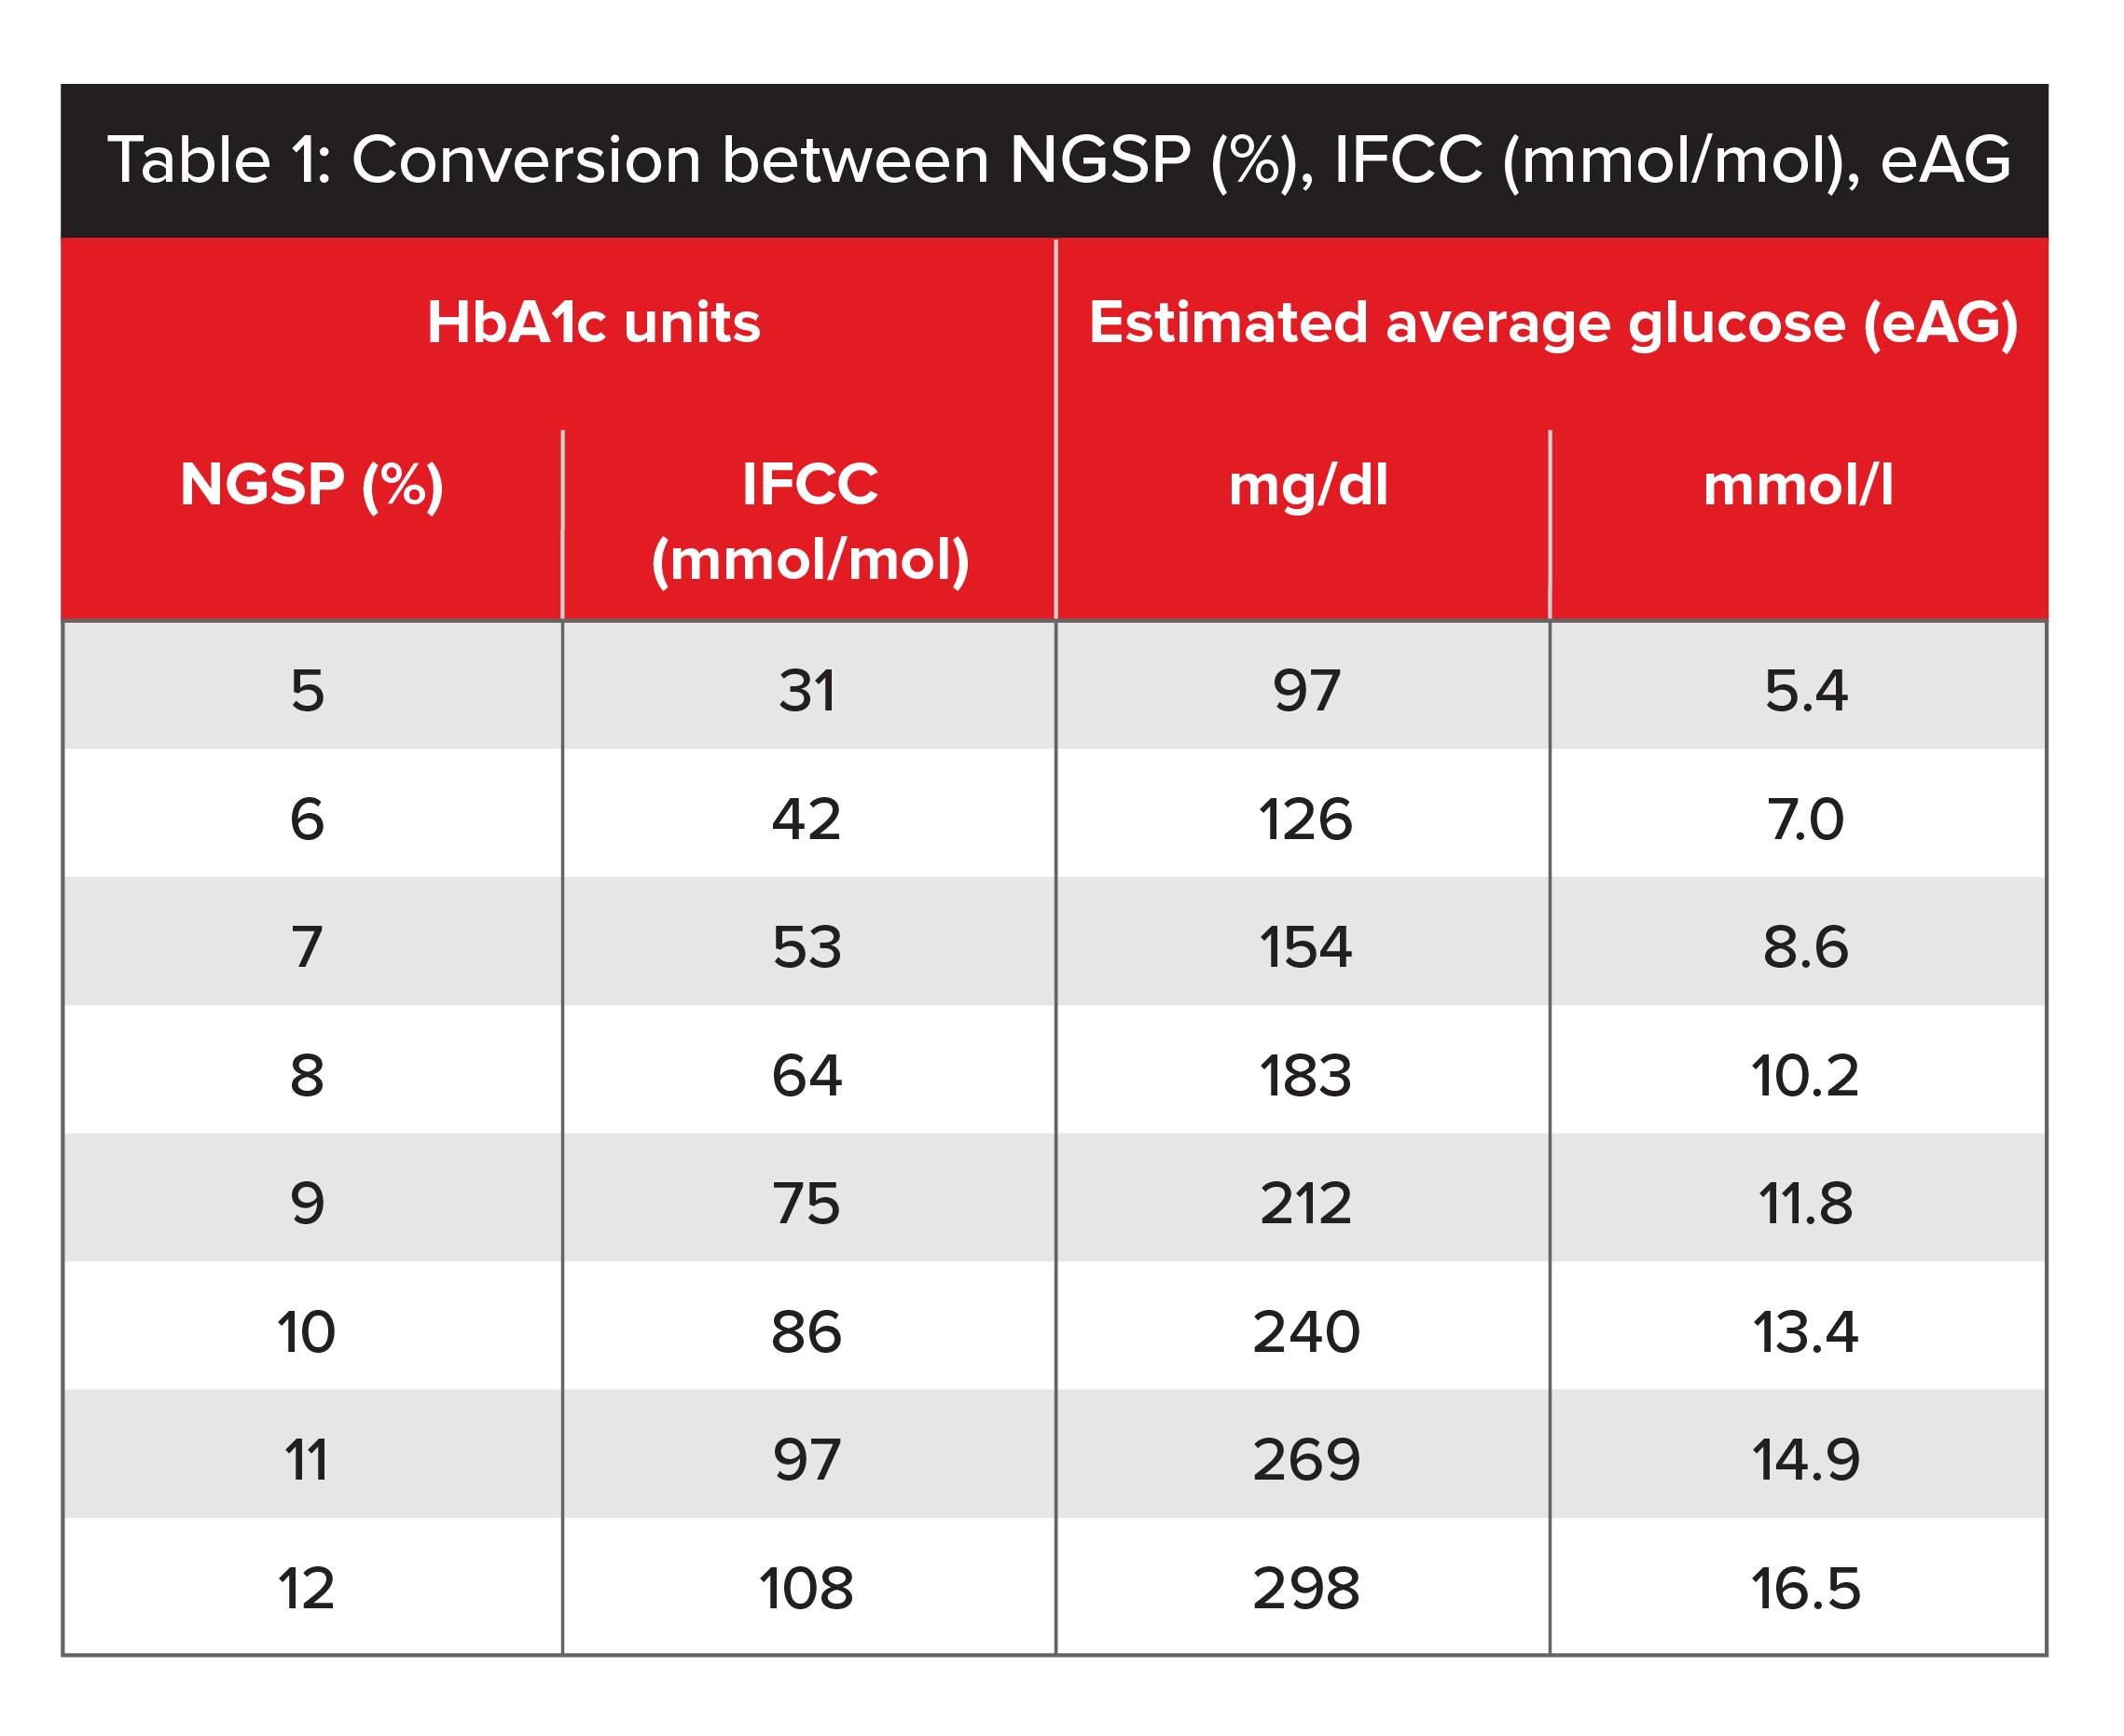
Source: IFCC Standardization of HbA1c.
For nearly a century, the Oral Glucose Tolerance Test (OGTT) was the established method of diagnosing diabetes and pre-diabetes. While many clinicians still consider OGTT to be the more accurate test, it requires pre-test fasting for 8 to 12 hours, and the actual test takes between 2 and 3 hours.
In 2011, an expert group at the World Health Organization (WHO) agreed the HbA1c test could be used to diagnose diabetes and recommended 6.5% as the diagnostic cutoff point.4 However, a value of less than 6.5% does not exclude diabetes, and WHO’s group did not make any formal recommendations to interpret HbA1c levels below 6.5%. Consequently, the American Diabetes Association (ADA) and U.K. National Institute for Health and Care Excellence (NICE) have each defined its own cutoff points for pre-diabetes (see Table 2, below).5
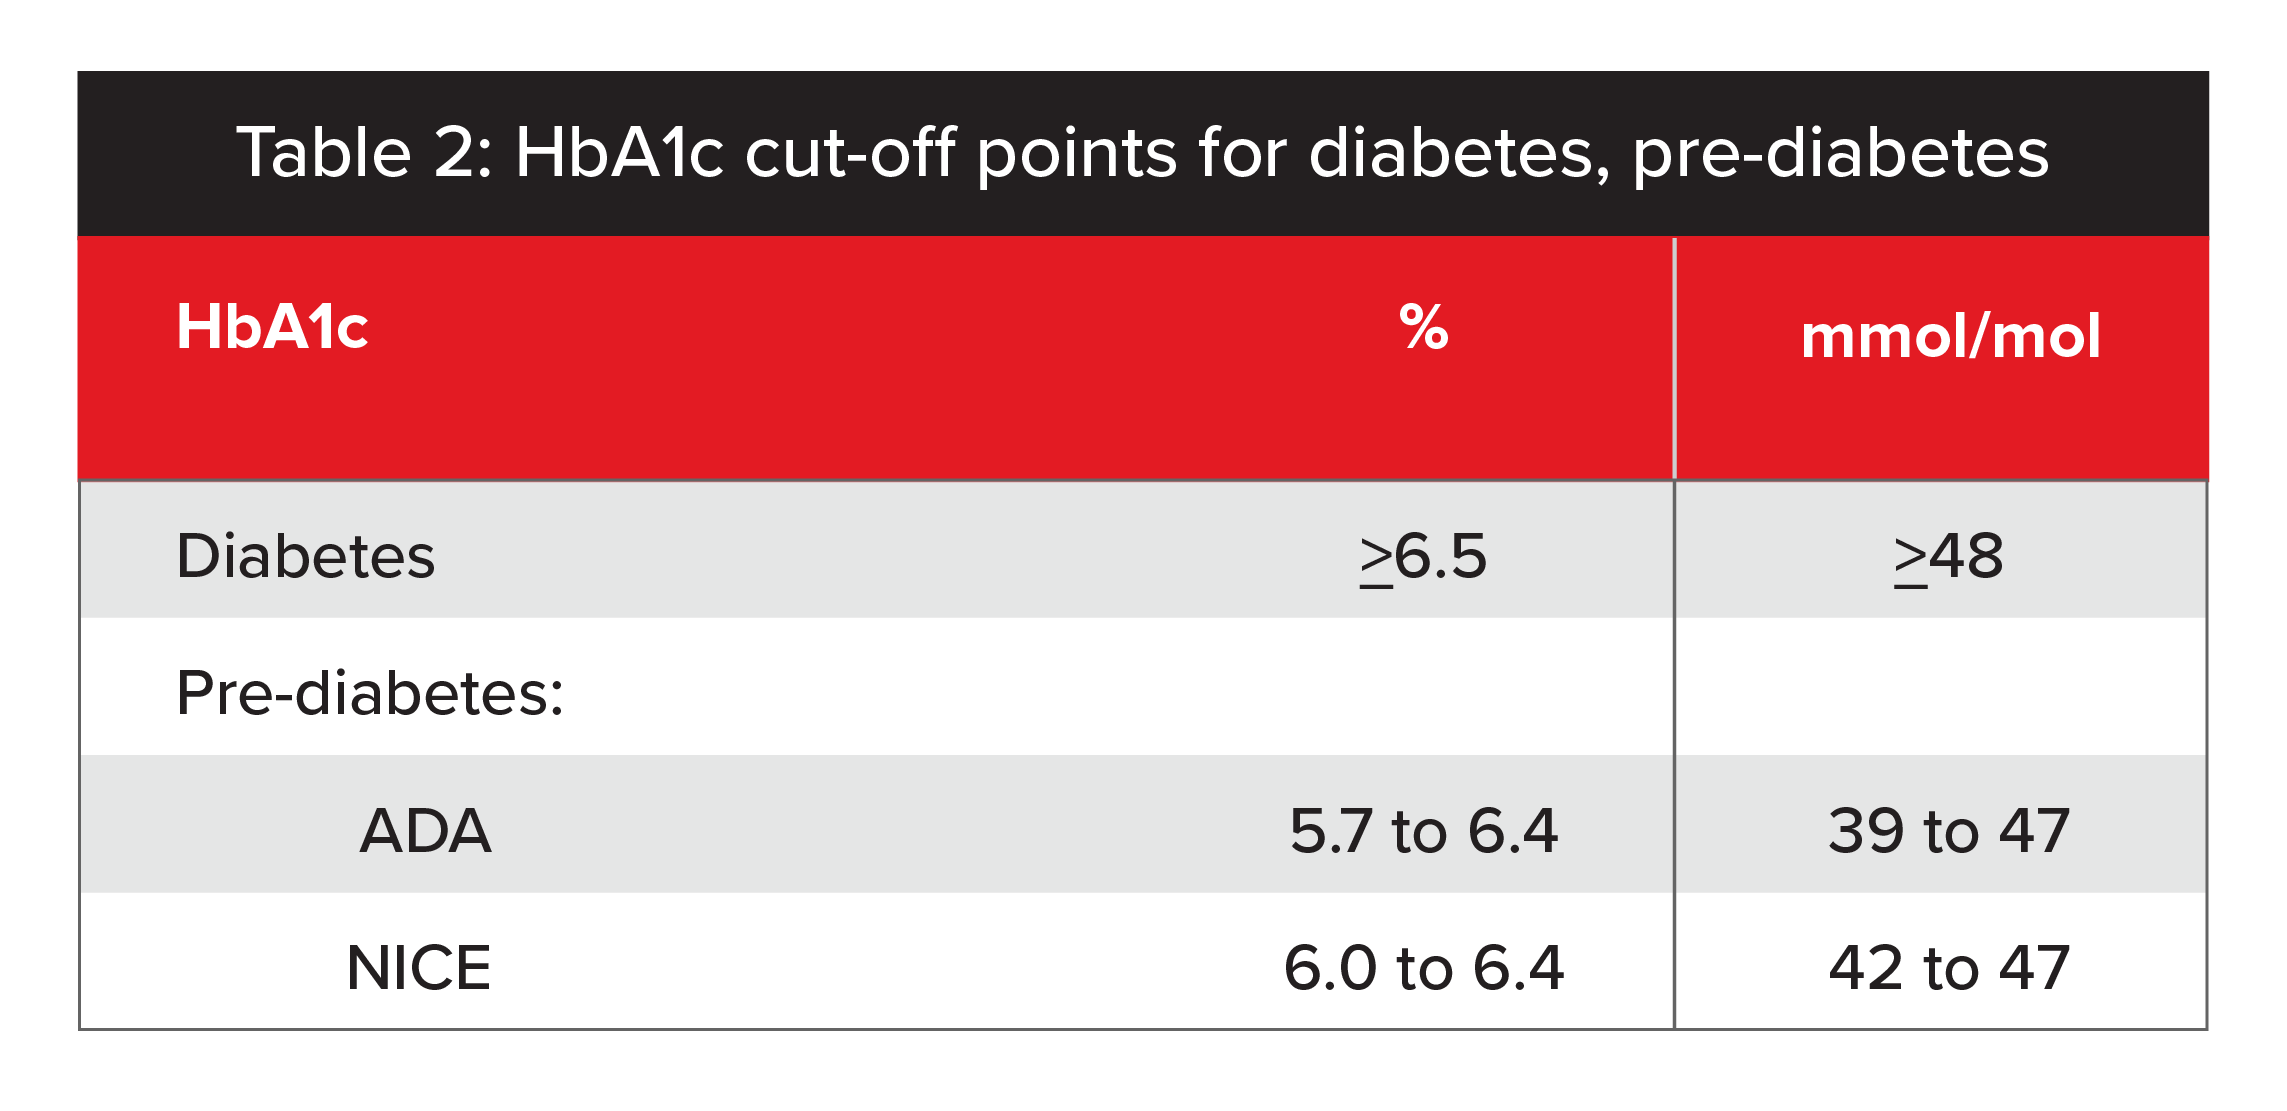
Source: Association between pre-diabetes and risk of cardiovascular disease and all-cause mortality: systematic review and meta-analysis.
HbA1c Levels in People With Diabetes
HbA1c tests are useful to assess how well people with diabetes control their condition and if they are being adequately treated. As we mentioned, HbA1c tests can give an indication of a diabetic’s blood sugar levels over the past 2 to 3 months. In addition, serial HbA1c test results, which are generally available from an applicant’s attending physician or from clinical lab test reports, can help confirm longer-term diabetes control.
Although routine HbA1c testing for insurance applicants can detect non-disclosure of diabetes, newer types of medical evidence, such as pharmacy, medical billing and electronic health reports, are increasingly being used by insurers to do so. These forms of evidence are often inexpensive, readily available at the policy point-of-sale, and do not require insurance applicants to submit to a blood draw. Given the success these reports have been having in revealing undisclosed diabetes, they reduce the exclusive protective value of HbA1c testing to detect non-disclosure. However, access and procurement of the newer information sources currently remains variable by product and carrier.
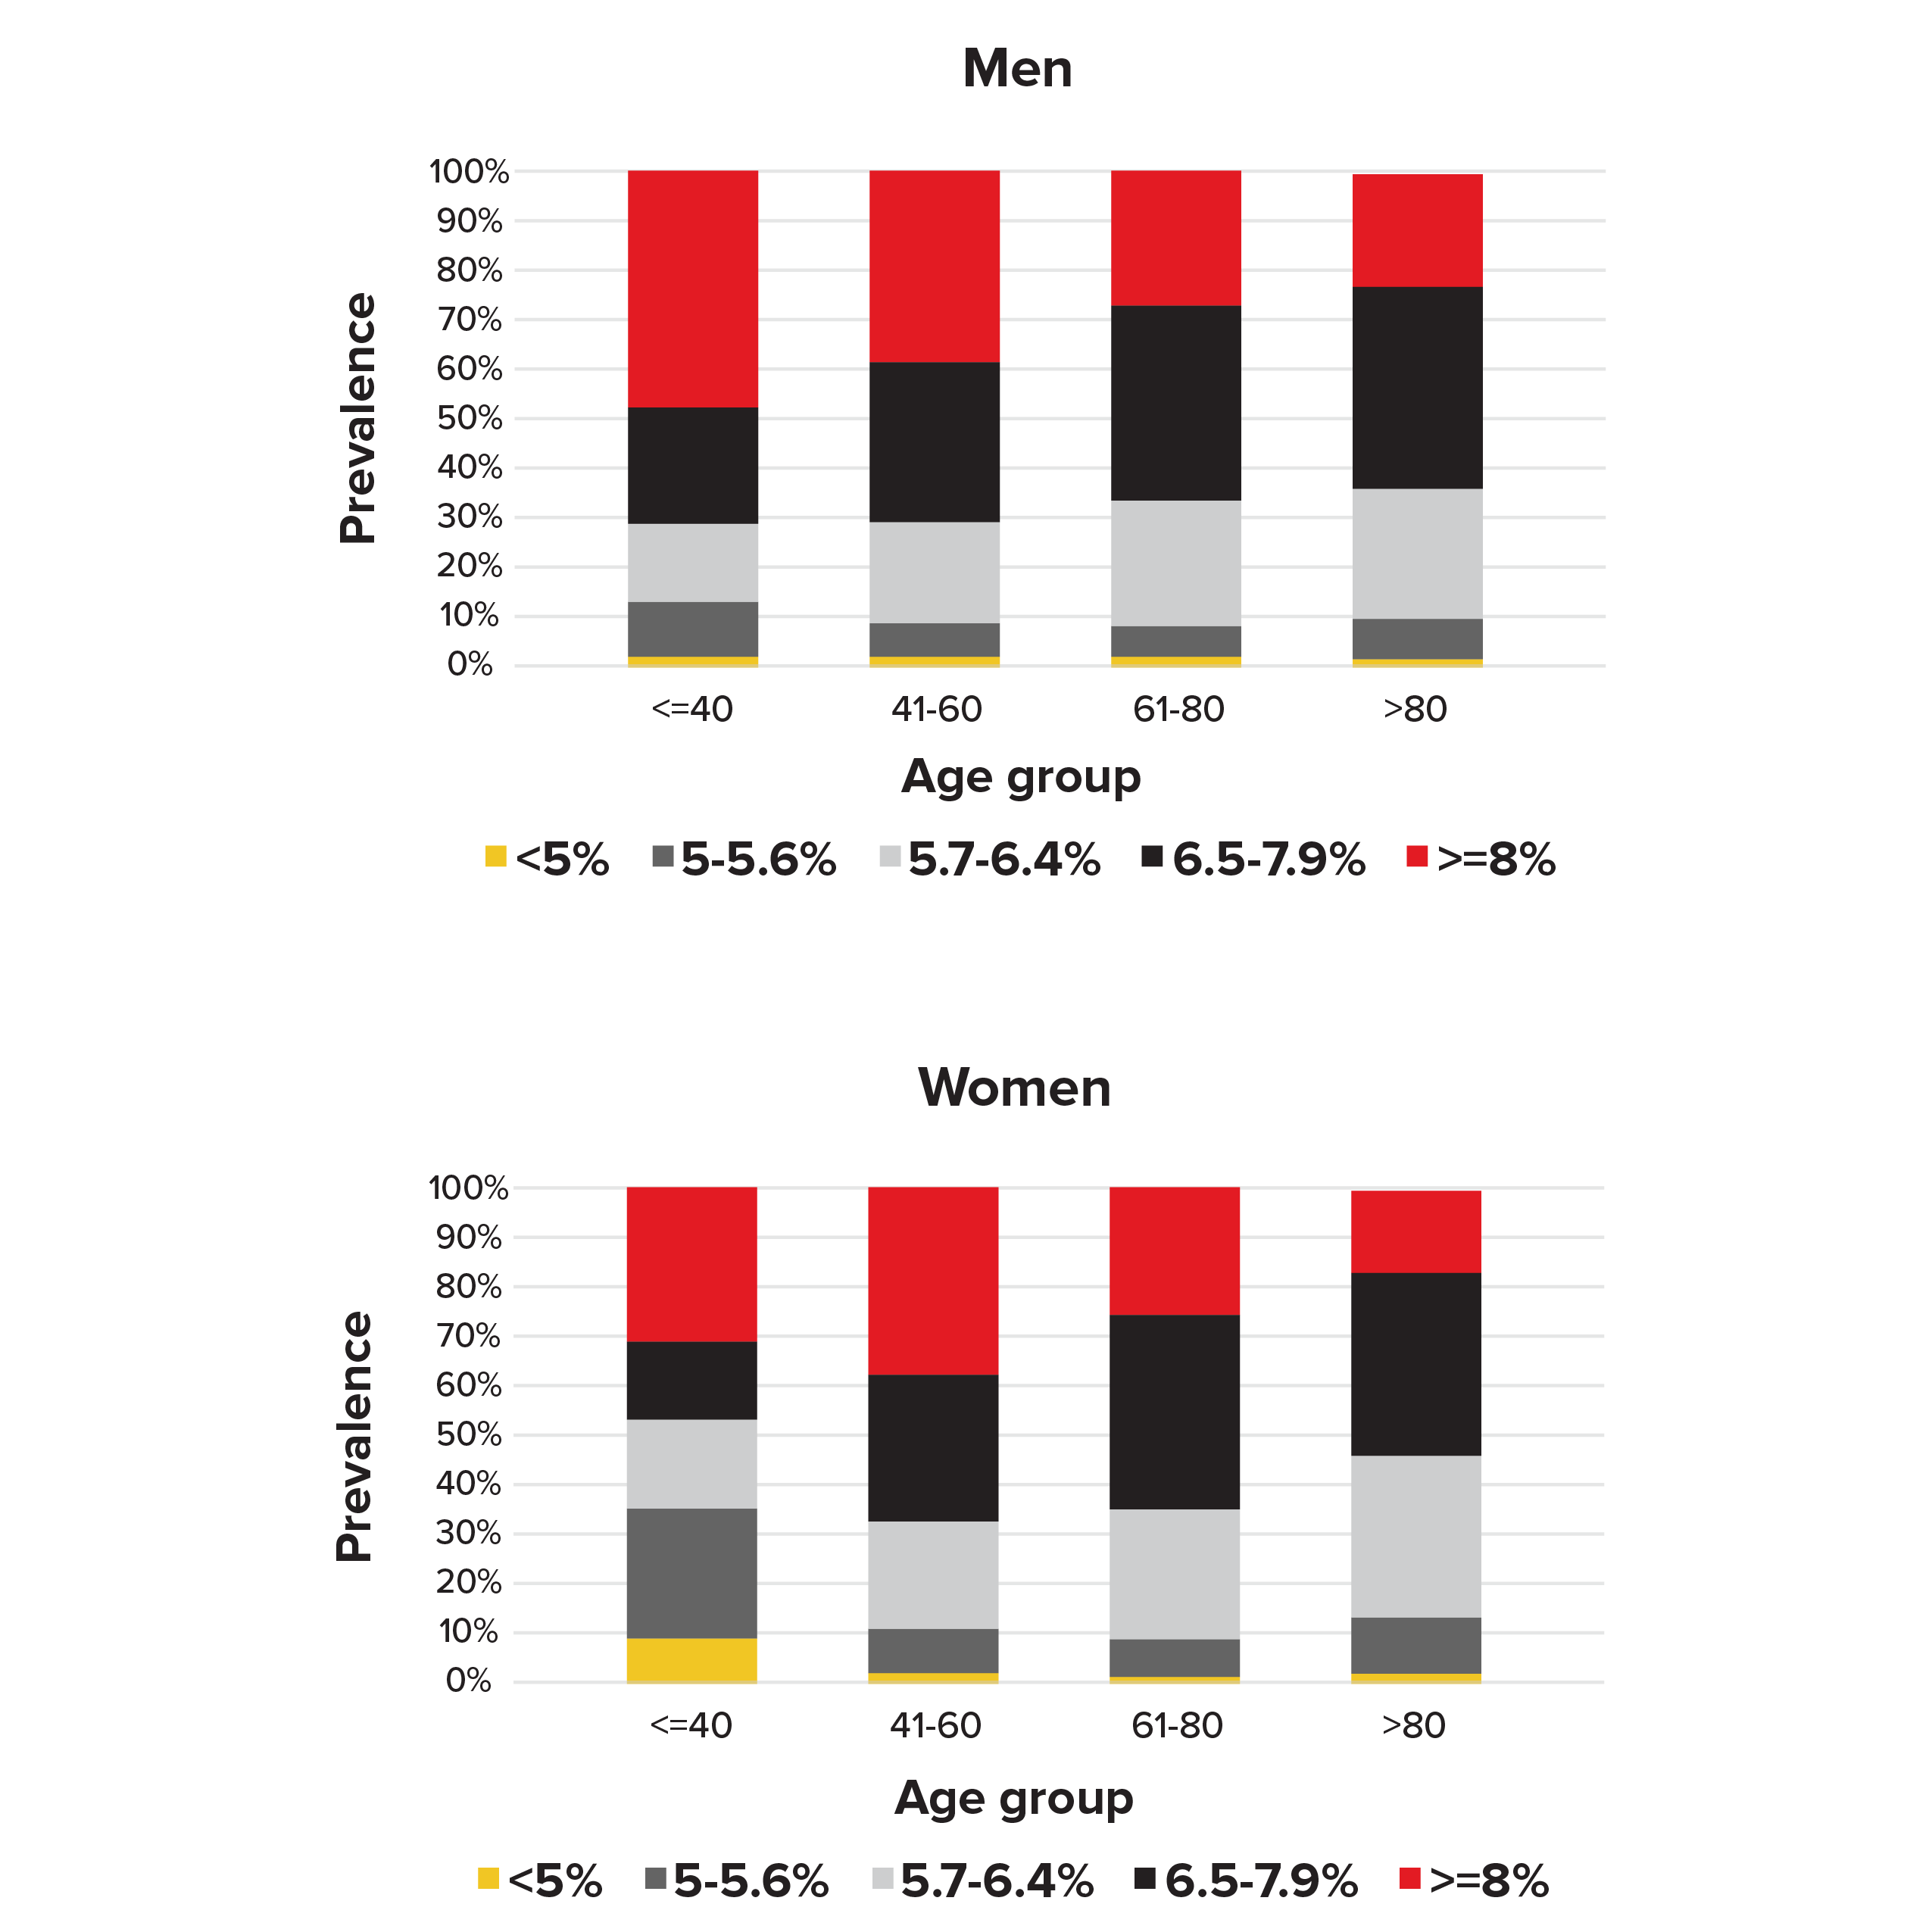
Our analysis of the NHANES data found that 32% of the men and 37% of the women with diabetes (defined as answering “yes” to the question of having been previously told by doctors they have diabetes) had HbA1c levels below the 6.5% diagnostic cut-off point for diabetes (see Figure 1). For women age 40 or younger, 54% had HbA1c levels below 6.5%. This suggests HbA1c tests can miss a proportion of people who non-disclose diabetes.
HbA1c testing can be used to detect undiagnosed Type 2 diabetes as well. Historically, HbA1c testing was done as a reflex test. Today, thanks to lower lab costs, HbA1c tests are done routinely. The protective value of HbA1c testing to detect undiagnosed diabetes depends mainly on the underlying prevalence of undiagnosed diabetes in the population being tested. According to a 2017 report from the CDC, the average undiagnosed diabetes rate in the US population is 2.9% (see Table 3).6
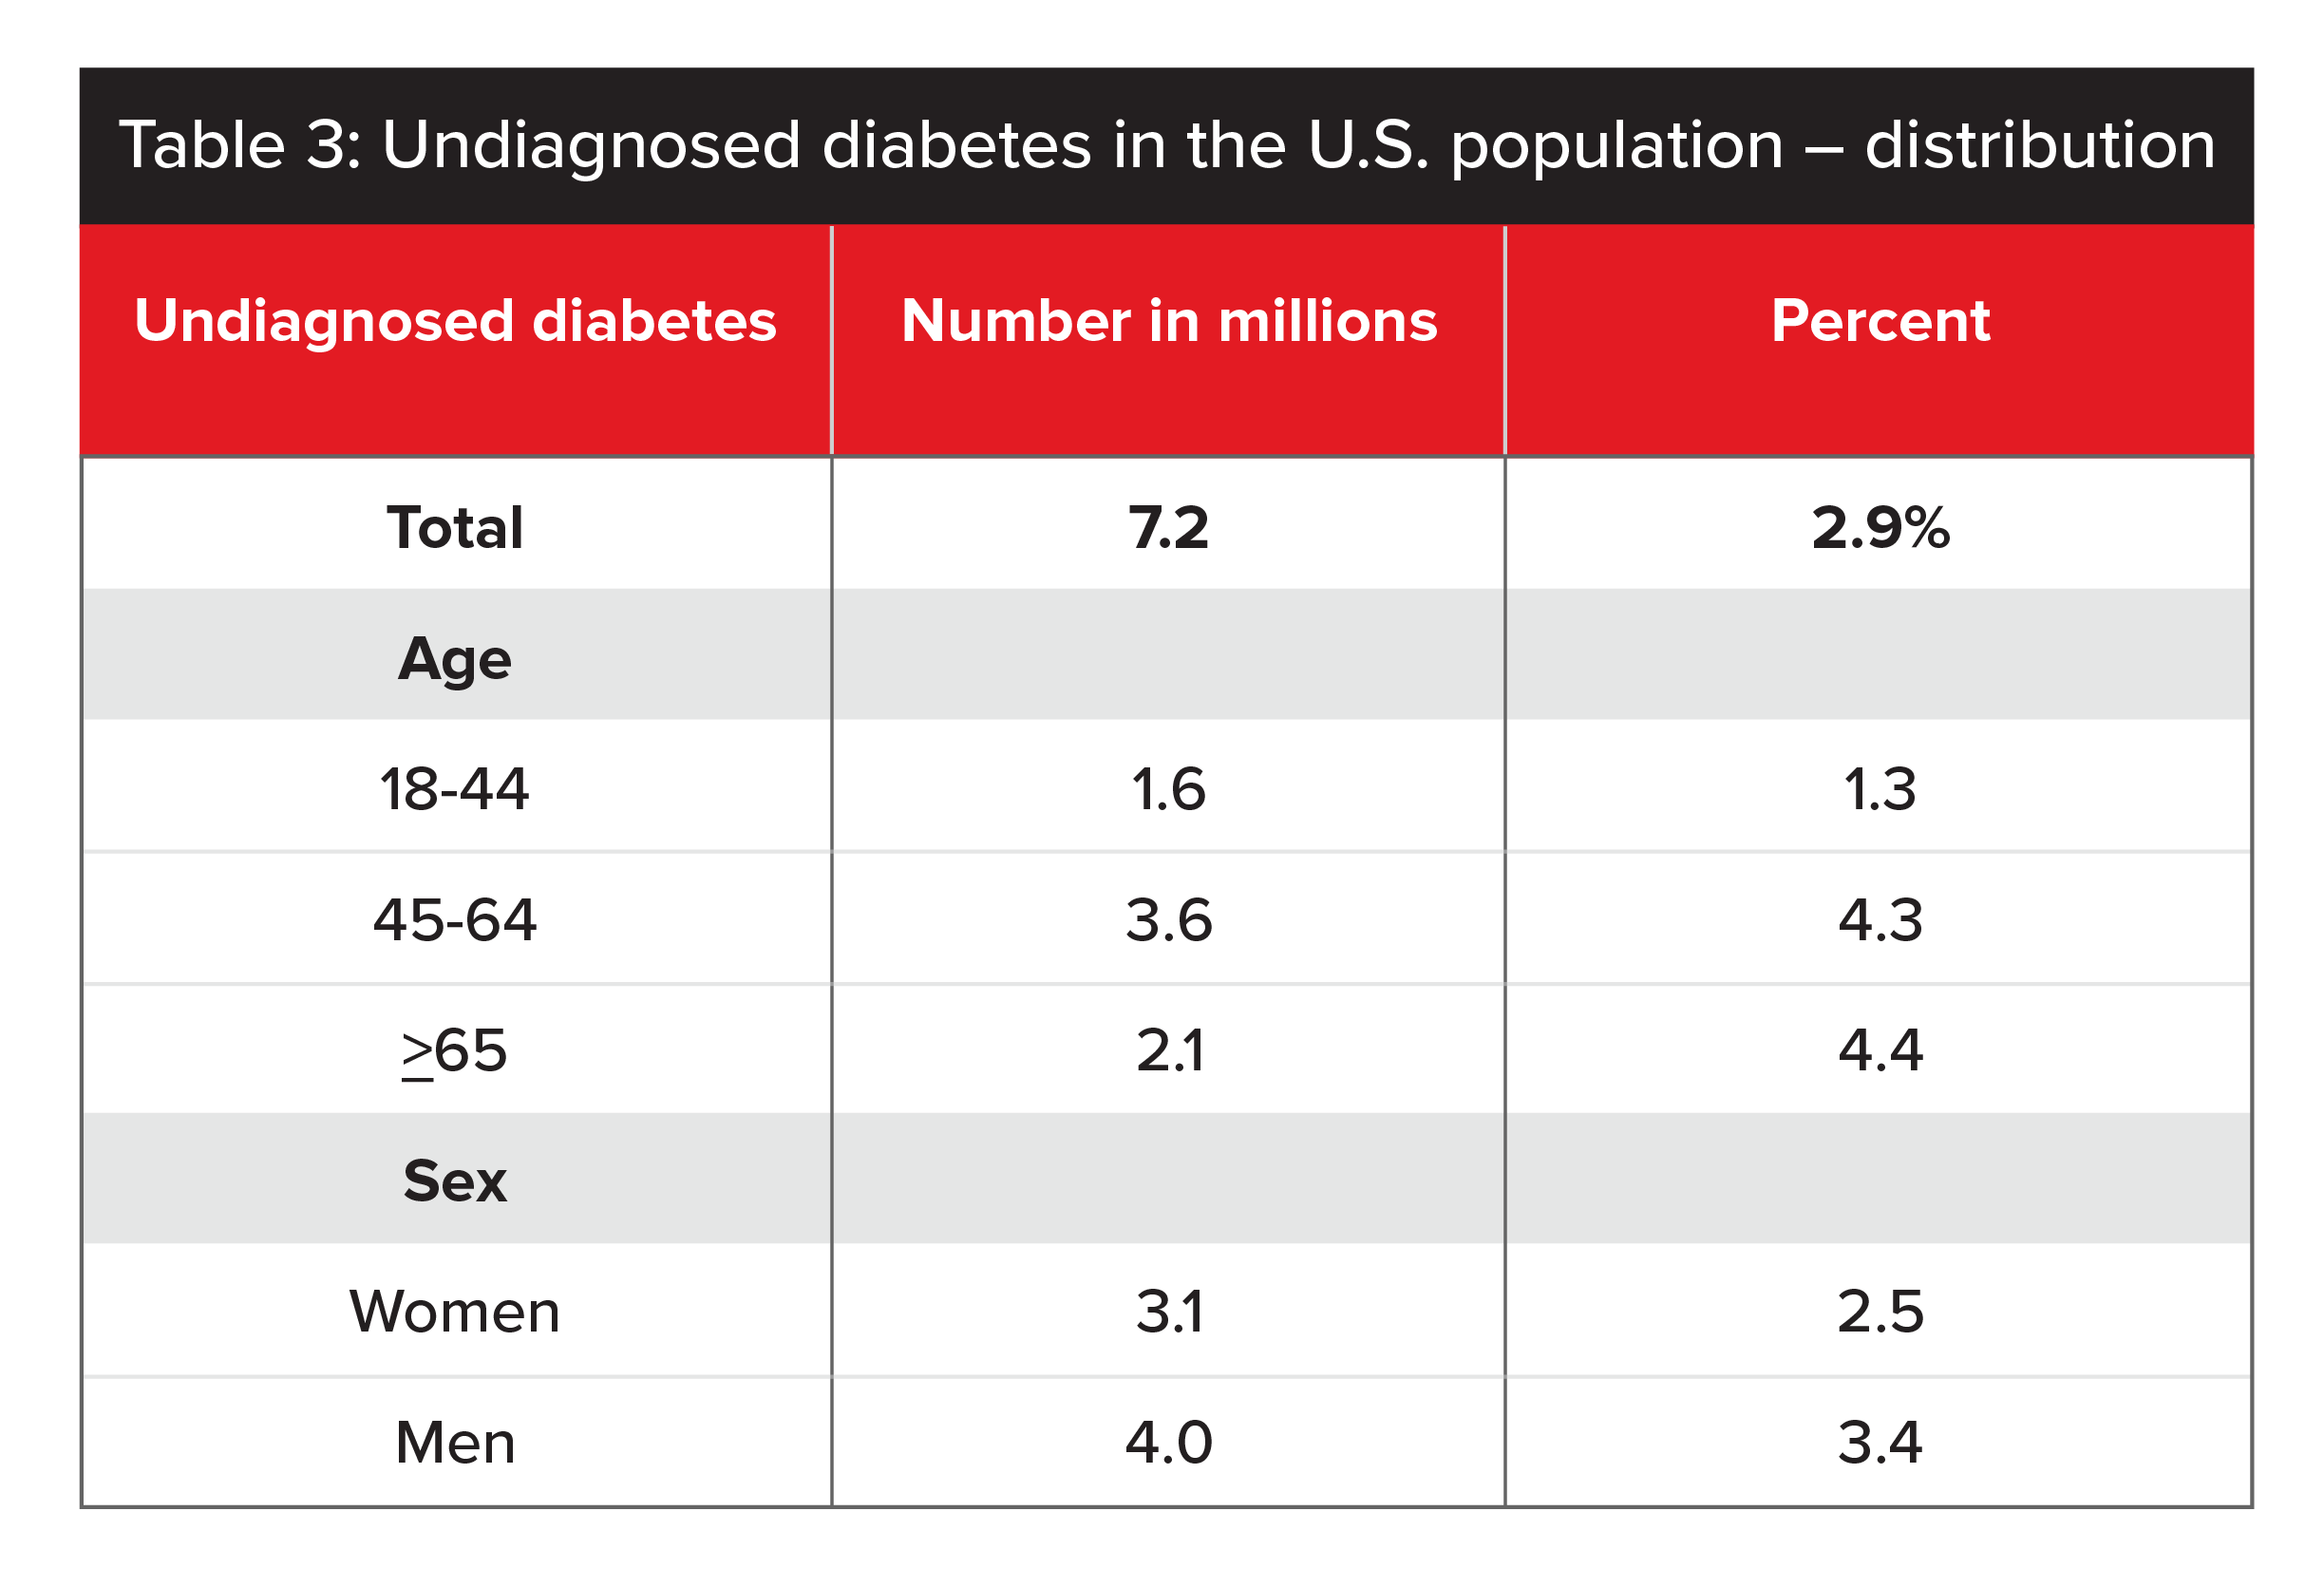
Sources: 2011-2014 NHANES and 2015 US Census Bureau data (CDC 2017).
In countries such as the US, with high levels of routine medical testing, the HbA1c test may be of lower value to insurers. This is particularly the case with younger people, due to the low prevalence of undiagnosed Type 2 diabetes in individuals under age 45 or in populations where annual health screening is customary.
Figure 1.
Prevalence of HbA1c levels by sex and age in people diagnosed with diabetes in NHANES 1988-2015
Raised HbA1c Levels in People Without Diabetes
In people without diabetes, increased HbA1c levels can be indicative of pre-diabetes (see Table 2, page 44, for cutoff levels). A diagnosis of pre-diabetes can include people with impaired fasting glucose (IFG), impaired glucose tolerance (IGT) and metabolic syndrome. Given the various definitions of pre-diabetes and cutoff points that vary from country to country, it is not surprising researchers report wide variations in terms of both prevalence rates and prognostic implications of pre-diabetes.
A 2017 meta-analysis of 24 studies reported a prevalence of pre-diabetes in Caucasian and Asian cohorts. The authors estimated prevalence of impaired fasting glucose at 36% using WHO guidelines and at 53% using ADA guidelines. This estimate, however, appears high when compared with prevalence rates for individuals who have both impaired fasting glucose and impaired glucose tolerance, which was 16% using WHO guidelines and 20% using ADA guidelines.7
In the U.S., an estimated 33.9% of adults had pre-diabetes in 2015. For adults age 65 and older, the estimate was 48.3%. Only 11.6% of adults with pre-diabetes reported being aware of their condition. These prevalence rates are based on fasting plasma glucose values of 100 to 125 mg/dL or HbA1c values of 5.7% to 6.4%. (Table 4, below, gives a full breakdown.)
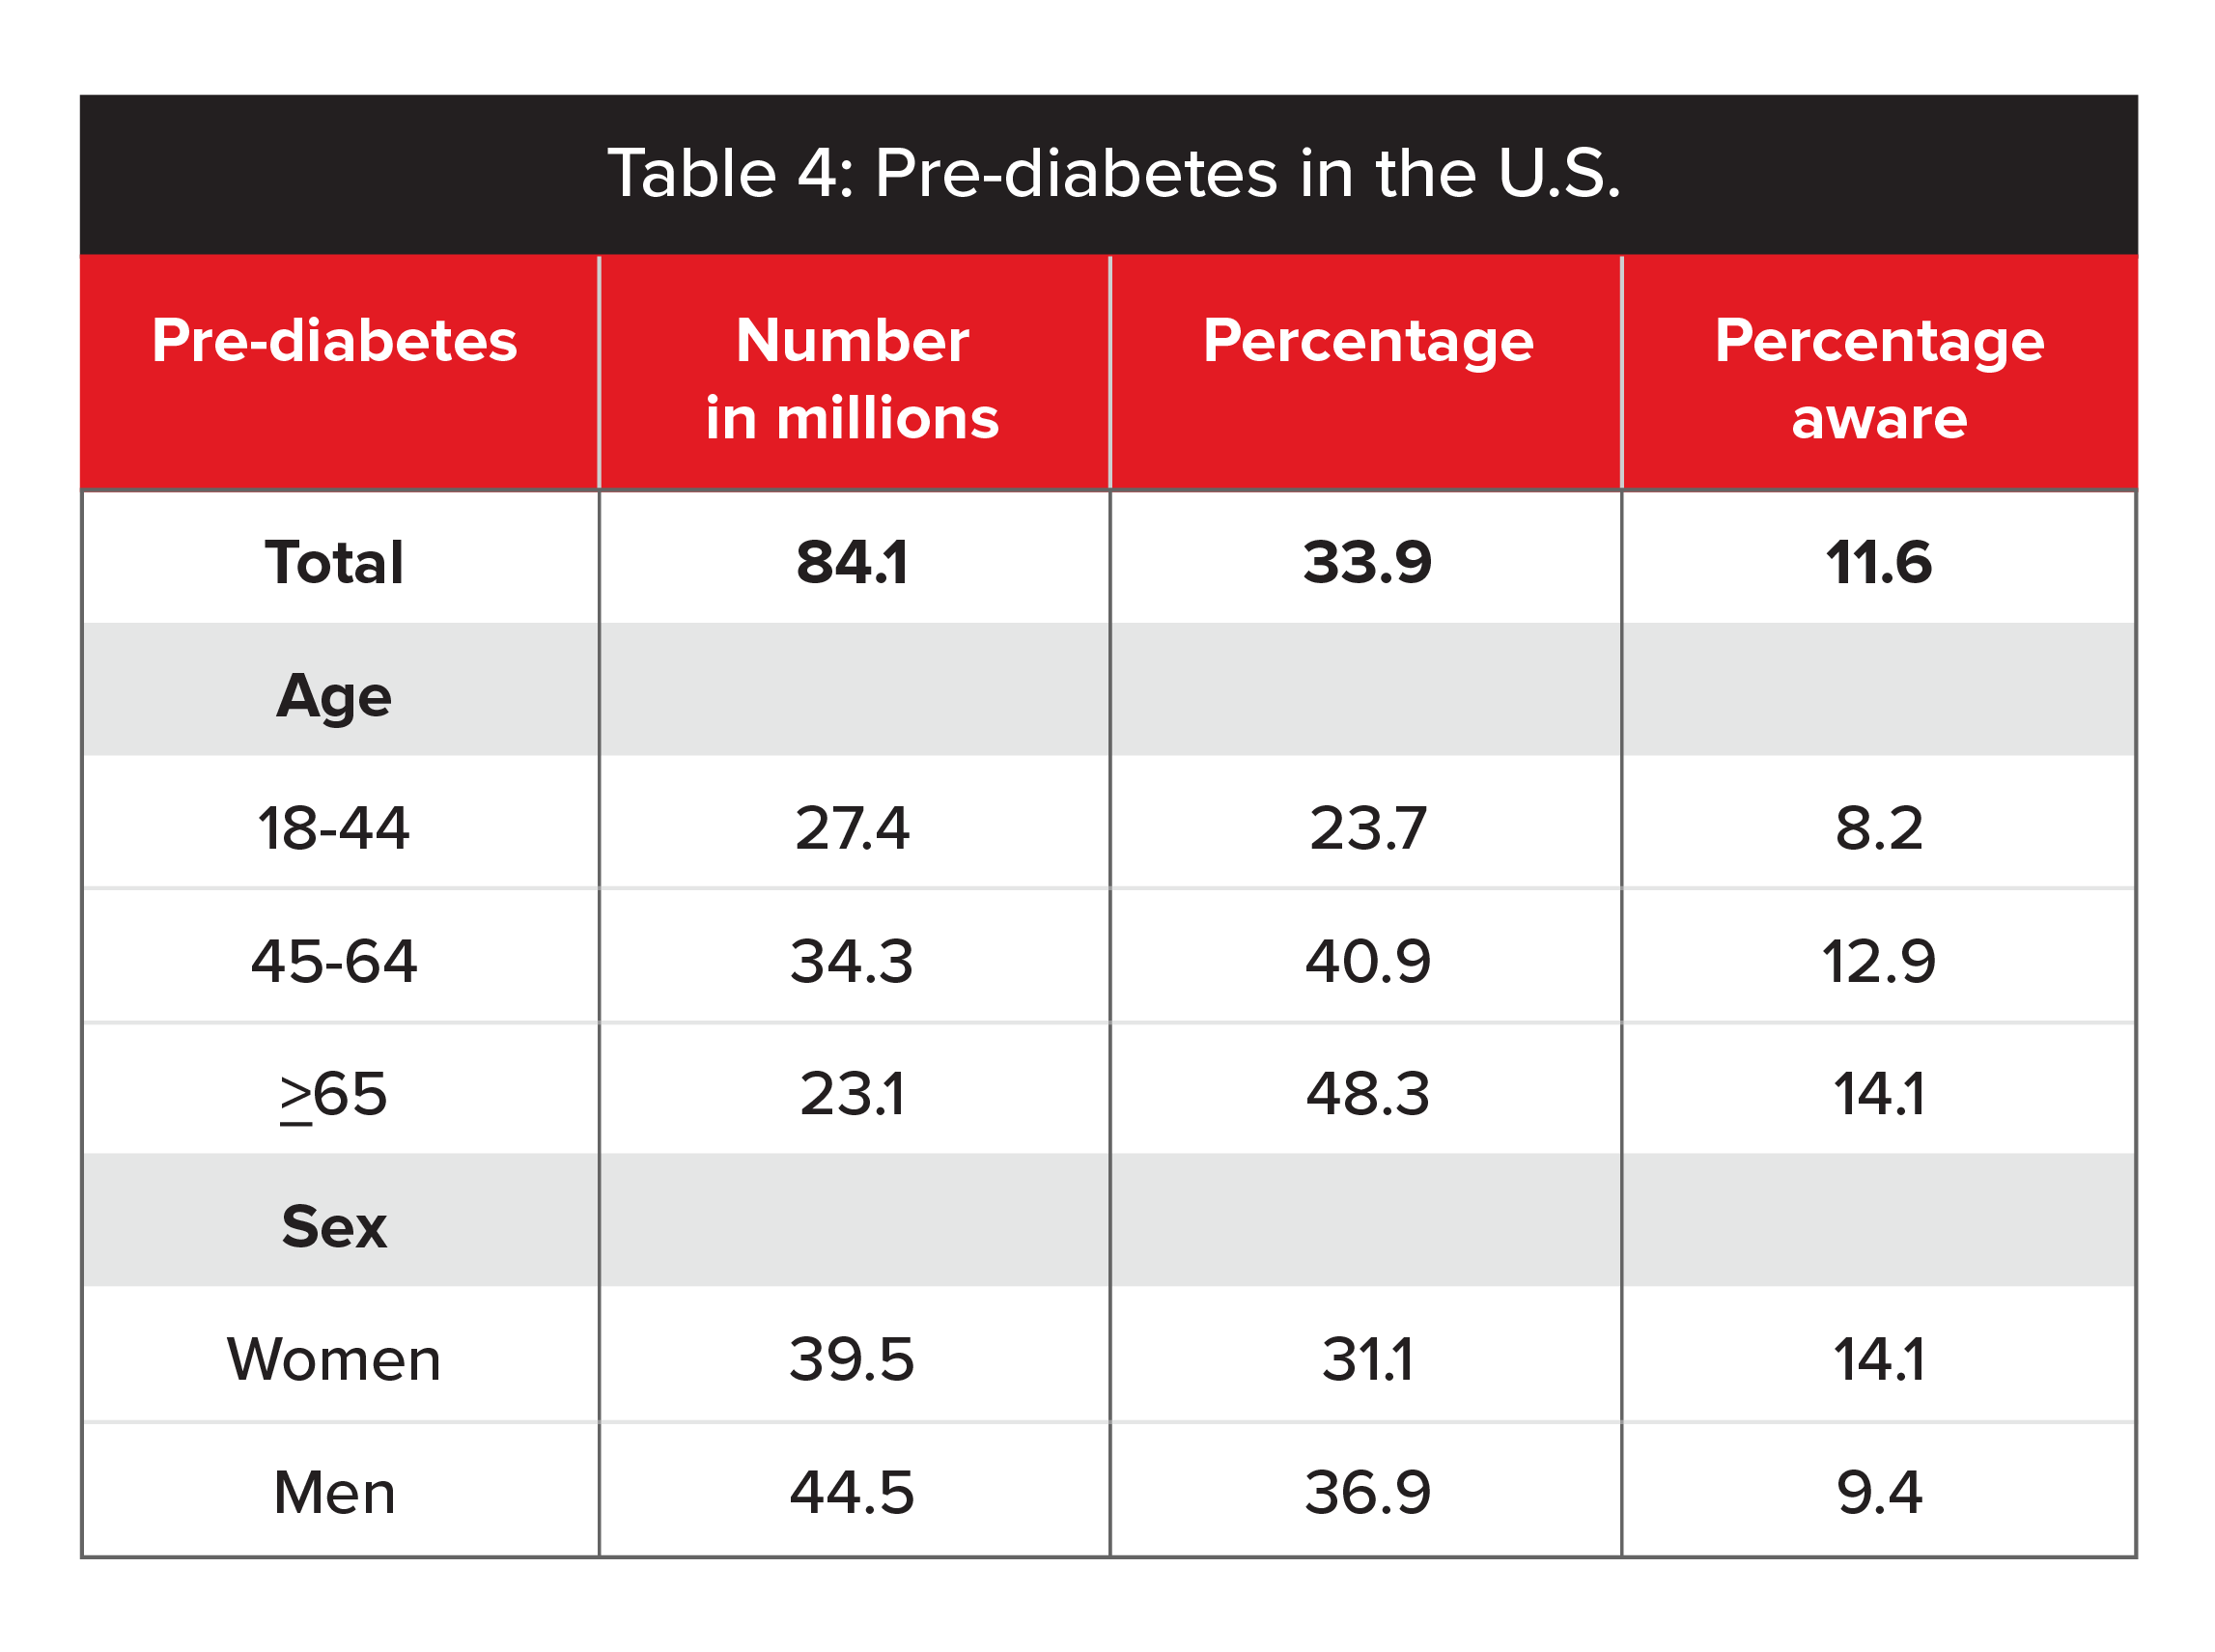
Source: 2011-2014 NHANES and 2015 US Census Bureau data (CDC 2017).
Meanwhile, according to the Health Survey for England, prevalence of pre-diabetes in England has increased markedly since 2003, rising from 11.6% to 35.3% in 2011.8 This 2014 survey used the ADA’s HbA1c cut-off points of 5.7% to 6.4%. While different age and time periods make it difficult to make a direct comparison with US data, the overall prevalence of pre-diabetes in approximately one-third of the population is consistent. (See Table 5 for a full breakdown.)
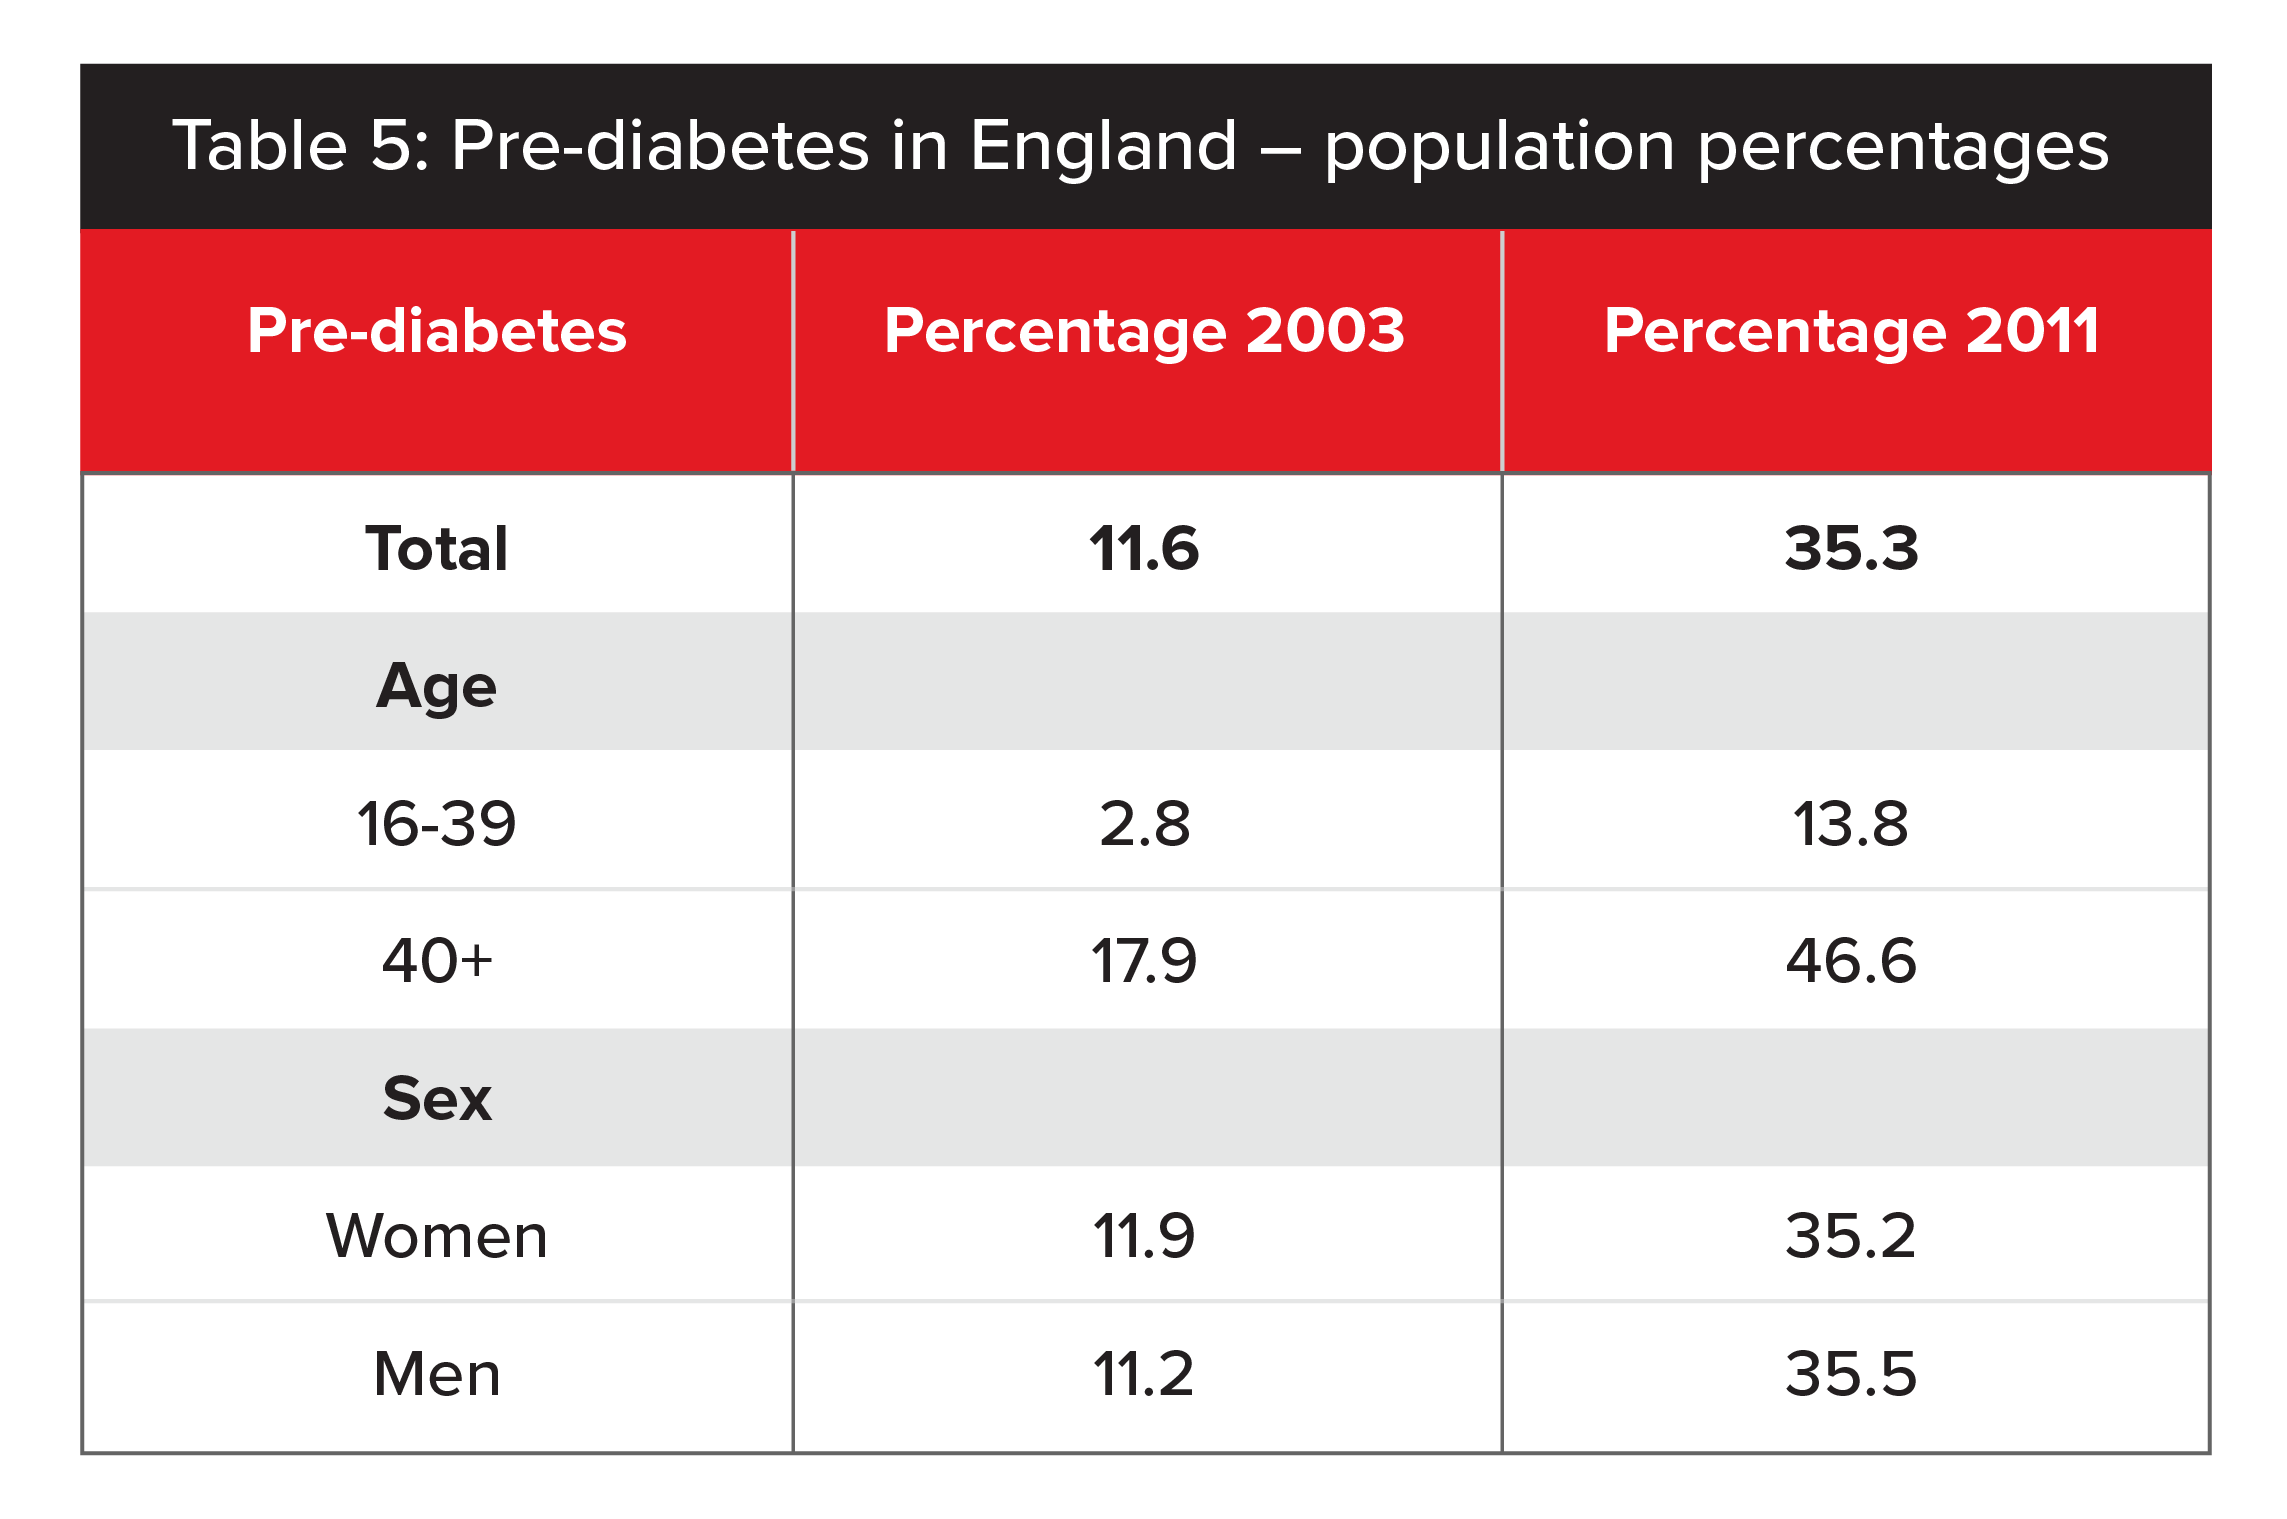
Source: Health Survey for England.
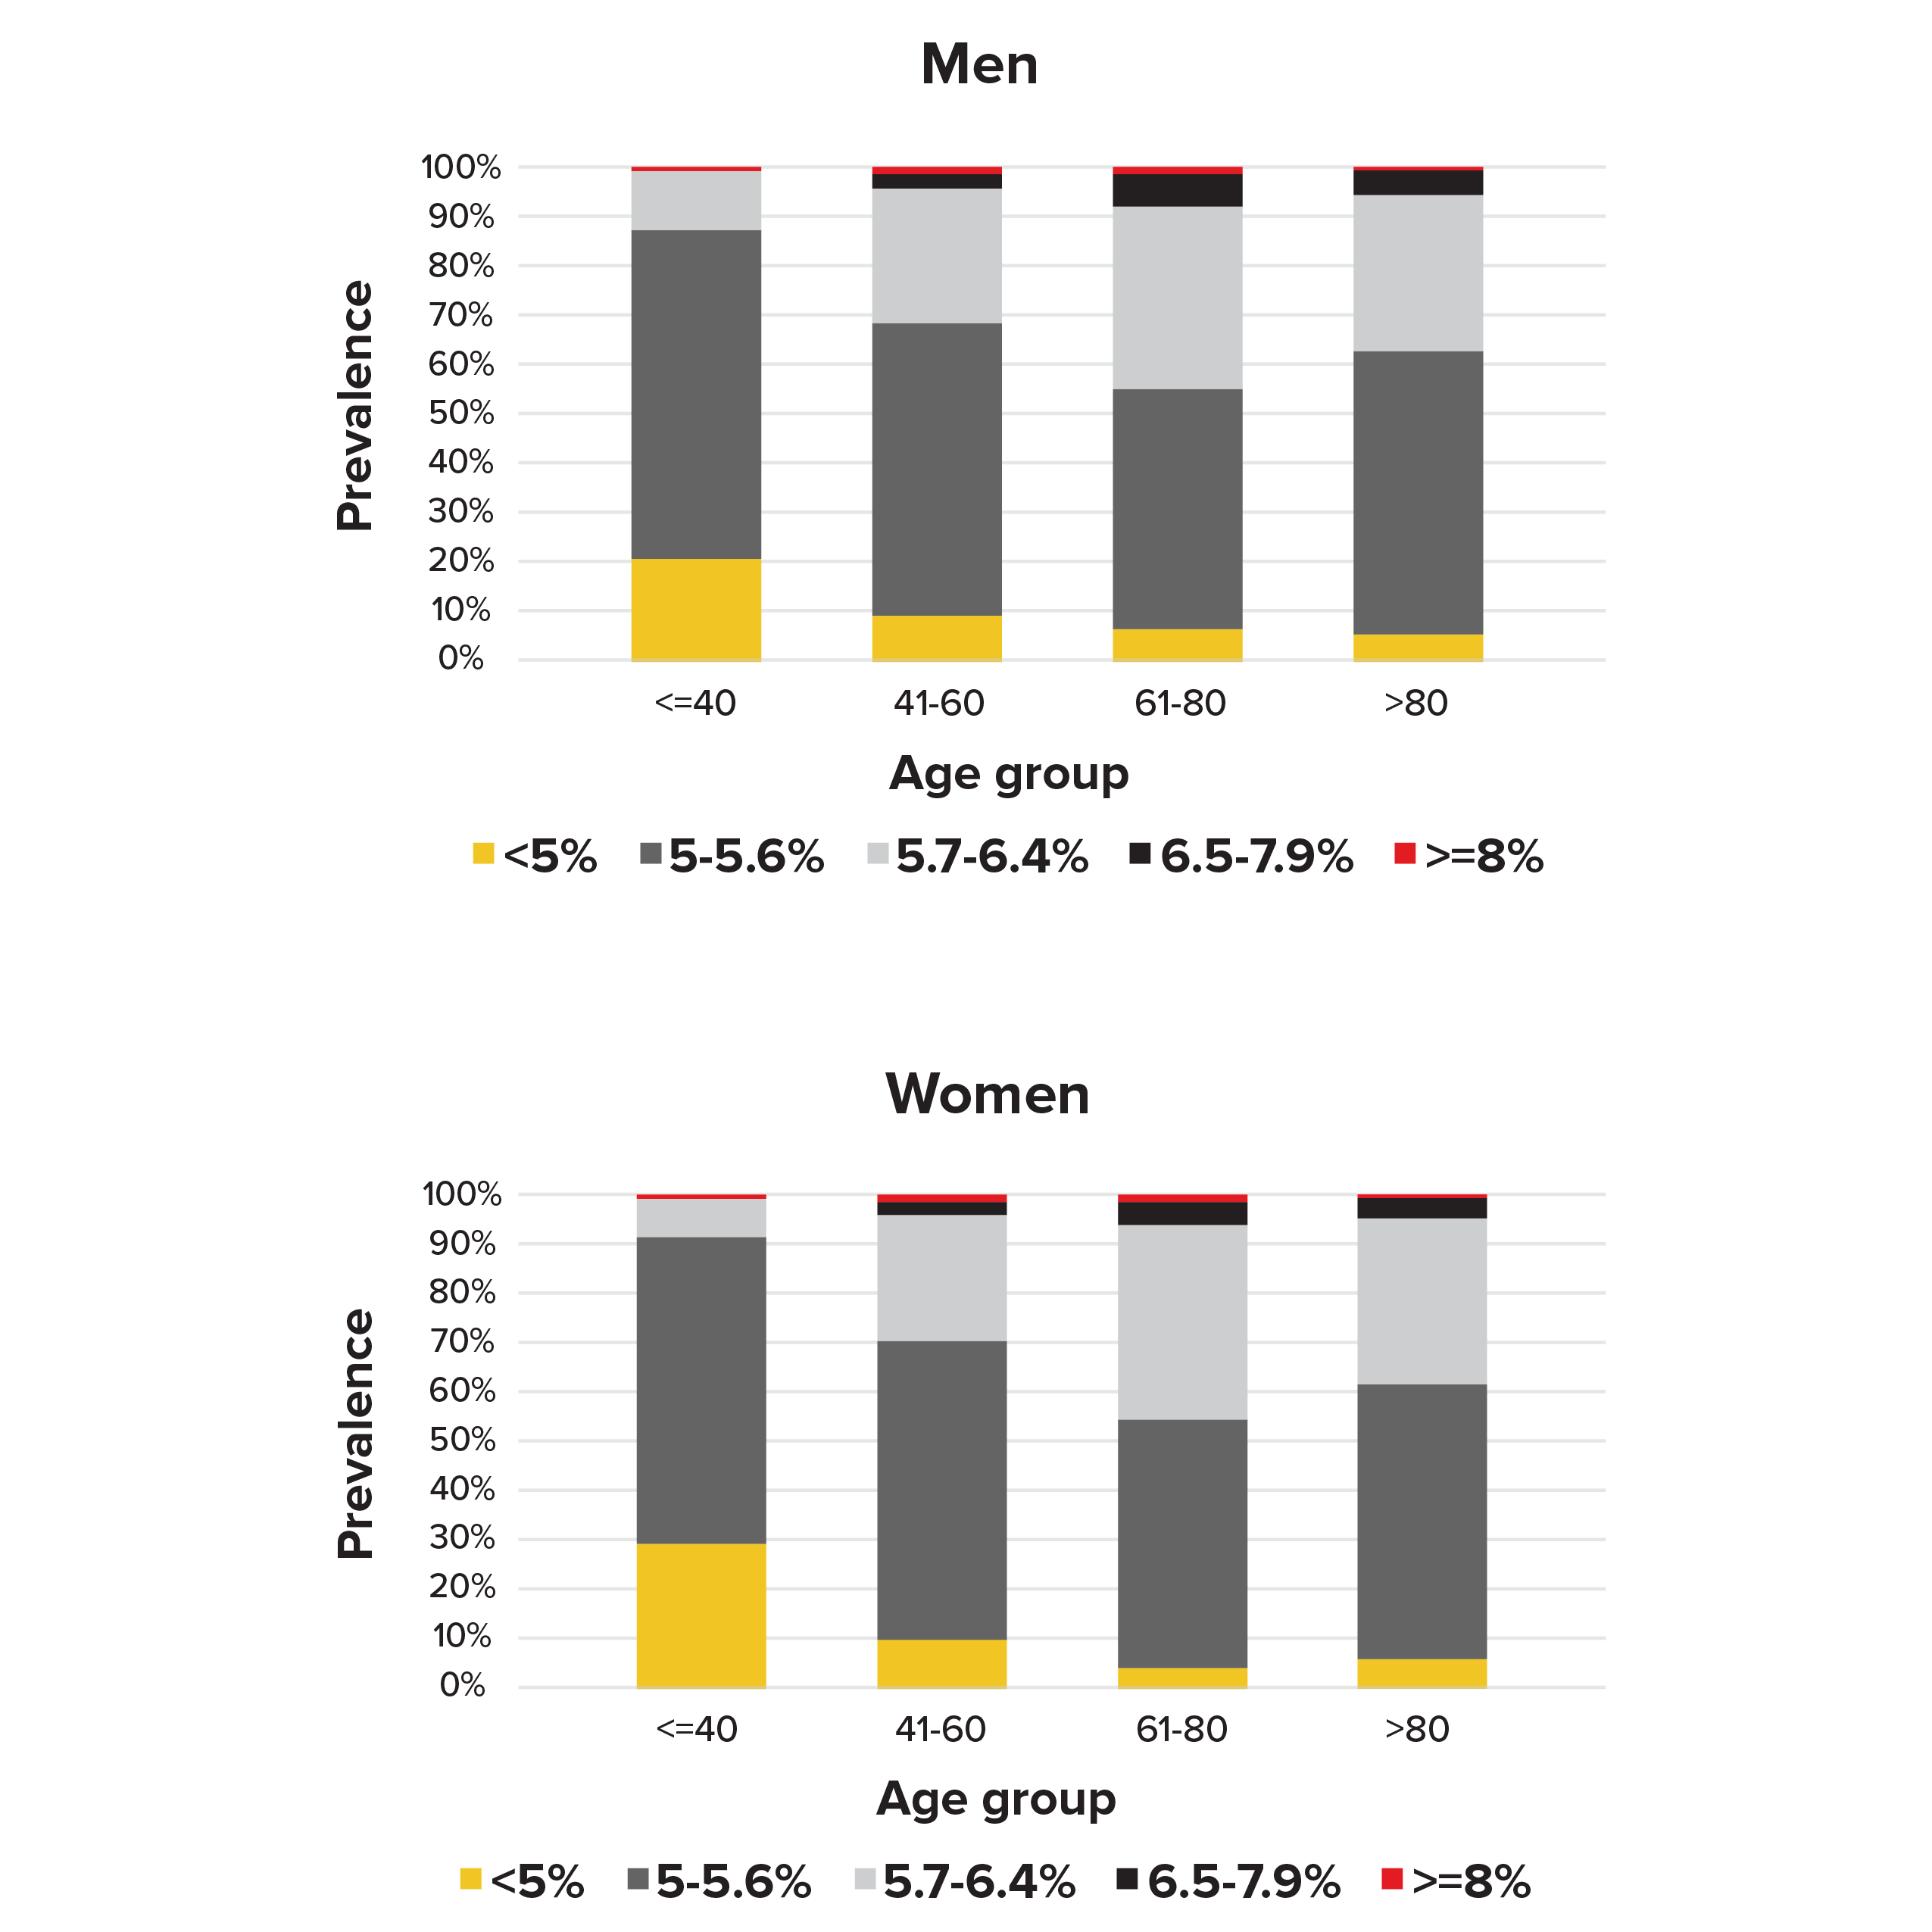
Our analysis of the NHANES subjects who had not previously been told by their doctors they had diabetes found that 22% of men (11%-38% depending on age) and 20% of women (7%-40% depending on age) had pre-diabetes, according to the ADA definition (see Figure 2).
Figure 2.
Prevalence of HbA1c groups by sex and age in people without diabetes in NHANES 1988-2015
Long-term mortality implications of pre-diabetes are not yet clear-cut. The current literature shows conflicting evidence about the long-term risk of progression to overt diabetes vs. the potential to reverse the condition with lifestyle modification through a healthier diet and increased physical activity. Table 6 (page 48) summarizes mortality results from recent studies.
Table 6.
Mortality data for raised HbA1c levels in people without diabetes |
|---|
| Study | Description | Findings |
Health and Retirement Study,
Li et al. (2019)9 | 15,869 participants, median age 64 (range 50 to 101), median follow-up 5.8 years | No increased risk of mortality related to pre-diabetes (ADA definition 5.7% to 6.4%) |
Framingham Heart Study, Echouffo-Tcheugui et al.(2018)10 | Offspring cohort mean age 42 (range 18 to 77) | Pre-diabetes was not significantly associated with increased risk of cardiovascular death vs. death from other causes (defined as fasting glucose 100-125 mg/dL) |
Systematic review and meta- analysis,
Cavero-Redondo et al. (2017)11 | 46 studies, age range 25 to 90, sample sizes ranged from 78 to 548,808 | Hazard ratio 1.16 (1.08-1.24, 95% CI) for HbA1c level 6.0% to 6.5% where reference value is HbA1c 5.0% to 6.0% |
Meta-analysis of prospective cohort studies,
Zhong et al. (2016)12 | 11 studies, 113,526 total participants | Hazard ratio 1.01 (0.99-1.03, 95% CI) after excluding participants with undiagnosed diabetes; i.e., HbA1c levels were not significantly associated with increased mortality |
Meta-analysis from 6 cohort studies,
Schottker et al. (2016)13 | 6 population-based cohort studies, 28,681 partici- pants, age > 50 | Hazard ratio 1.18 (1.02-1.37, 95% CI) and 1.14 (1.04-1.26, 95% CI) for ages 50 to 64 and > 65 respectively |
Systematic review and meta- analysis, Huang et al. (2016)5 | 53 prospective cohort studies with 1,611,339 participants | Pre-diabetes was not associated with an increased risk of all-cause mortality; hazard ratio 0.97 (0.88-1.07 95% CI) and 1.21 (0.95-1.56 95% CI) using ADA and NICE HbA1c definitions, respectively |
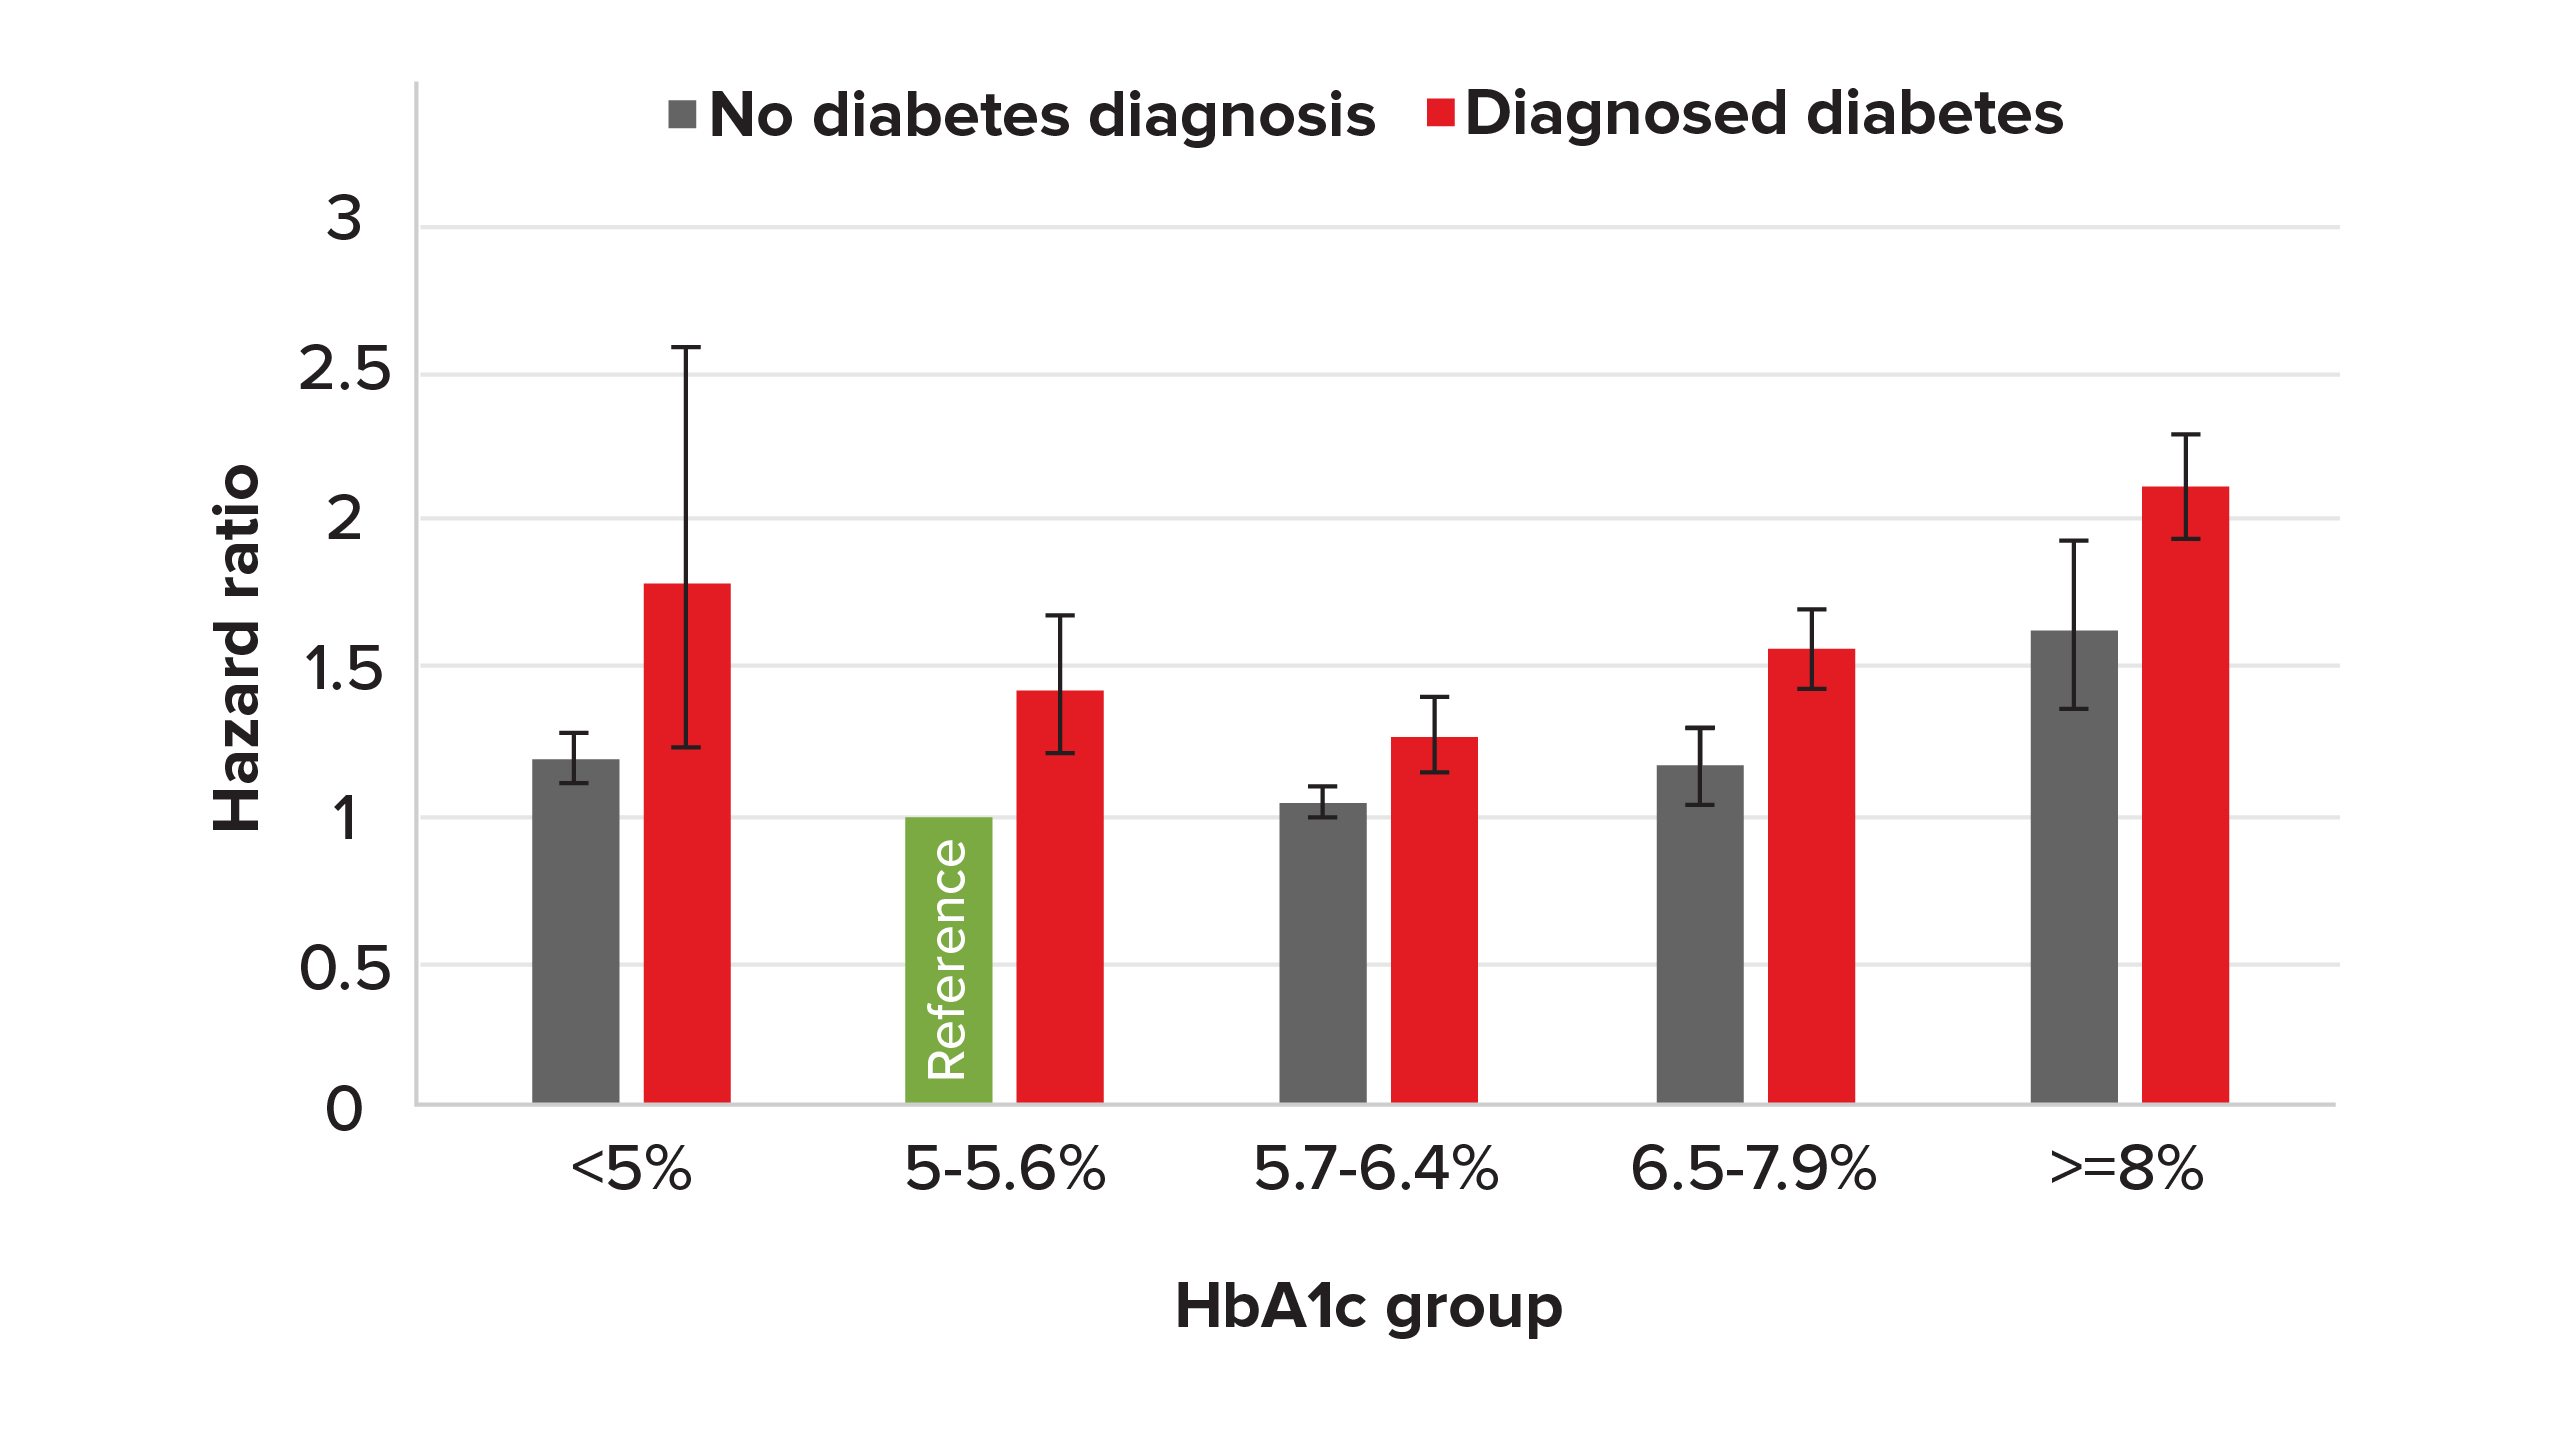
Our analysis of the NHANES data found hazard ratios for people with pre-diabetes (HbA1c results between 5.7% and 6.4%) was 1.05 (0.999-1.10, 95% CI), (see Figure 3).
Figure 3.
Hazard ratios with 95% confidence inter- vals by HbA1c group for those with/without diabetes (HbA1c 5%-5.6%, no diabetes diagnosis [green bar], as reference), NHANES 1988-2015
Low HbA1c Levels in People Without Diabetes
Note the U-shaped curve in Figure 3. In people with- out diabetes, there is no agreed lower cut-off point for HbA1c. However, with the widespread use of HbA1c testing, low HbA1c values are often detected. The definition of low HbA1c varies from study to study, with researchers using 4%, 4.5% or even 5% as the cut-off point.
Several research studies have suggested that with HbA1c, it is not a case of “the lower the better.” There are many medical conditions that affect red blood cell turnover, which can cause low HbA1c levels. (Table 7, next page, shows a list of such conditions).14
Table 7:
Conditions where low RBC turnover can decrease HbA1c levels |
|---|
Increased RBC production due to high altitudes, pregnancy |
Hemorrhage or chronic bleeding |
Hemolytic anemia |
Chronic kidney failure |
Liver cirrhosis, chronic hepatitis, ribavirin use |
Alcoholic liver disease |
Folic acid deficiency |
Hemoglobinopathies; e.g., thalassemia major |
Spherocytosis |
Aplastic anemia |
Source: What Clinical Laboratorians Should Do in Response to Extremely Low HbA1c Results.
Several studies have reported slightly increased mortality risk for those with low or very low HbA1c levels. It was not always possible for studies to adjust for underlying confounding factors, which can include age, gender, race/ethnicity, smoker status, alcohol consumption, BMI, blood pressure, biomarkers of iron deficiency anemia and liver function, and history of chronic diseases. A 2016 study by Schottker et al.13 used NHANES III data (a subset of NHANES data limited to subjects older than age 50) to adjust for all known confounding risk factors, and found that mortality risk was not significantly increased. Other studies have shown controlling for confounding factors may attenuate the low HbA1c impact, but it remains statistically significant (see Table 8).
Table 8:
Mortality data for low HbA1c levels in people without diabetes |
|---|
Study | Description | Findings |
Health and Retirement Study, Li et al. (2019)9 | 15,869 participants, median age 64 (range 50-101); me- dian follow-up 5.8 years | Hazard ratio 1.60 (1.21-2.07, 95% CI) and 1.30 (1.02-1.65, 95% CI) for very low (<4.88%) and low (4.88%-5.02%) HbA1c where reference HbA1c is > 5.02% and < 5.38% |
Systematic review and meta-analysis, Cavero-Redondo et al. (2017)11 | 46 studies, age range 25 to 90; sample sizes ranged from 78 to 548,808 | Hazard ratio 1.19 (1.04-1.36, 95% CI) for HbA1c level < 5% where reference HbA1c is 5.0% to 6.0% |
Meta-analysis from six cohort studies, Schottker et al. (2016)13 | 6 population-based cohort studies; 28,681 participants, age > 50 | After adjusting for confounding factors (race/ ethnicity, alcohol consumption, BMI, and biomarkers of iron deficiency anemia and liver function), very low HbA1c (< 5%) was not found to be associated with increased mortality with a HR of 1.1 (0.9-1.2, 95% CI) |
NHANES study, Carson et al. (2010)15 | NHANES III, 14,099 participants, age > 20 | An HbA1c < 4.0% vs. 5.0% to 5.4% was associated with an increased risk of all-cause mortality, hazard ratio 2.9 (1.45 to 9.63, 95% CI) |
Our analysis of the NHANES data is shown in Figure 3 (page 48). The hazard ratio for HbA1c levels of < 5% for people without diabetes was 1.19 (1.11-1.28, 95% CI). After adjusting for common confounding factors, the hazard ratio remained significant in our analysis. (Note: We used NHANES data consisting of nine waves of surveys including the most recent mortality update. The NHANES analyses listed in Table 8 (page 49) covers only the third wave of NHANES.)
Figure 3 (page 48) also suggests the U- (or J-) shaped HbA1c mortality curve is more prominent in people with diabetes. Although the confidence interval for low HbA1c levels among people with diabetes is quite wide (due to smaller sample size), it does support the notion that aggressive treatment of diabetes to reduce HbA1c levels is not necessarily beneficial.
Mortality Implications
It is well known and accepted that mortality increases as HbA1c increases. However, it is important to know the precise hazard ratio for any given HbA1c level in order to perform mortality analysis. Also, it is important to ensure hazard ratios take account of any confounding factors. For example, as we can see in Figure 3 (page 48), an established diagnosis of diabetes can be a strong confounding factor (there is a strong correlation between diabetes and HbA1c levels, and diabetes independently increases mortality risk). Other known confounding factors include age, gender, smoker status, BMI, blood pressure and history of chronic diseases.
The ability to adjust for a range of confounding factors is a major strength of our analysis of NHANES data. Table 9 illustrates the impact of confounding factors on hazard ratios according to how much adjustment for confounders occurs. We found that after adjusting for commonly recognized confounding factors, mortality increased by 11% for each 1% increase in HbA1c. Our analysis suggests older studies that did not fully adjust for people with diabetes could have overstated the mortality impact of increased HbA1c levels. It is notable when the hazard ratio is only adjusted for age, gender and smoker status, the ratio is very similar to hazard ratios reported by some older studies. Full adjustment of other confounding factors significantly attenuates the hazard ratio and illustrates how the protective value of HbA1c differs, according to the adjustment of confounders. Of course, the ability to adjust for confounding factors will depend greatly on the underwriting process (e.g., full vs. accelerated underwriting).
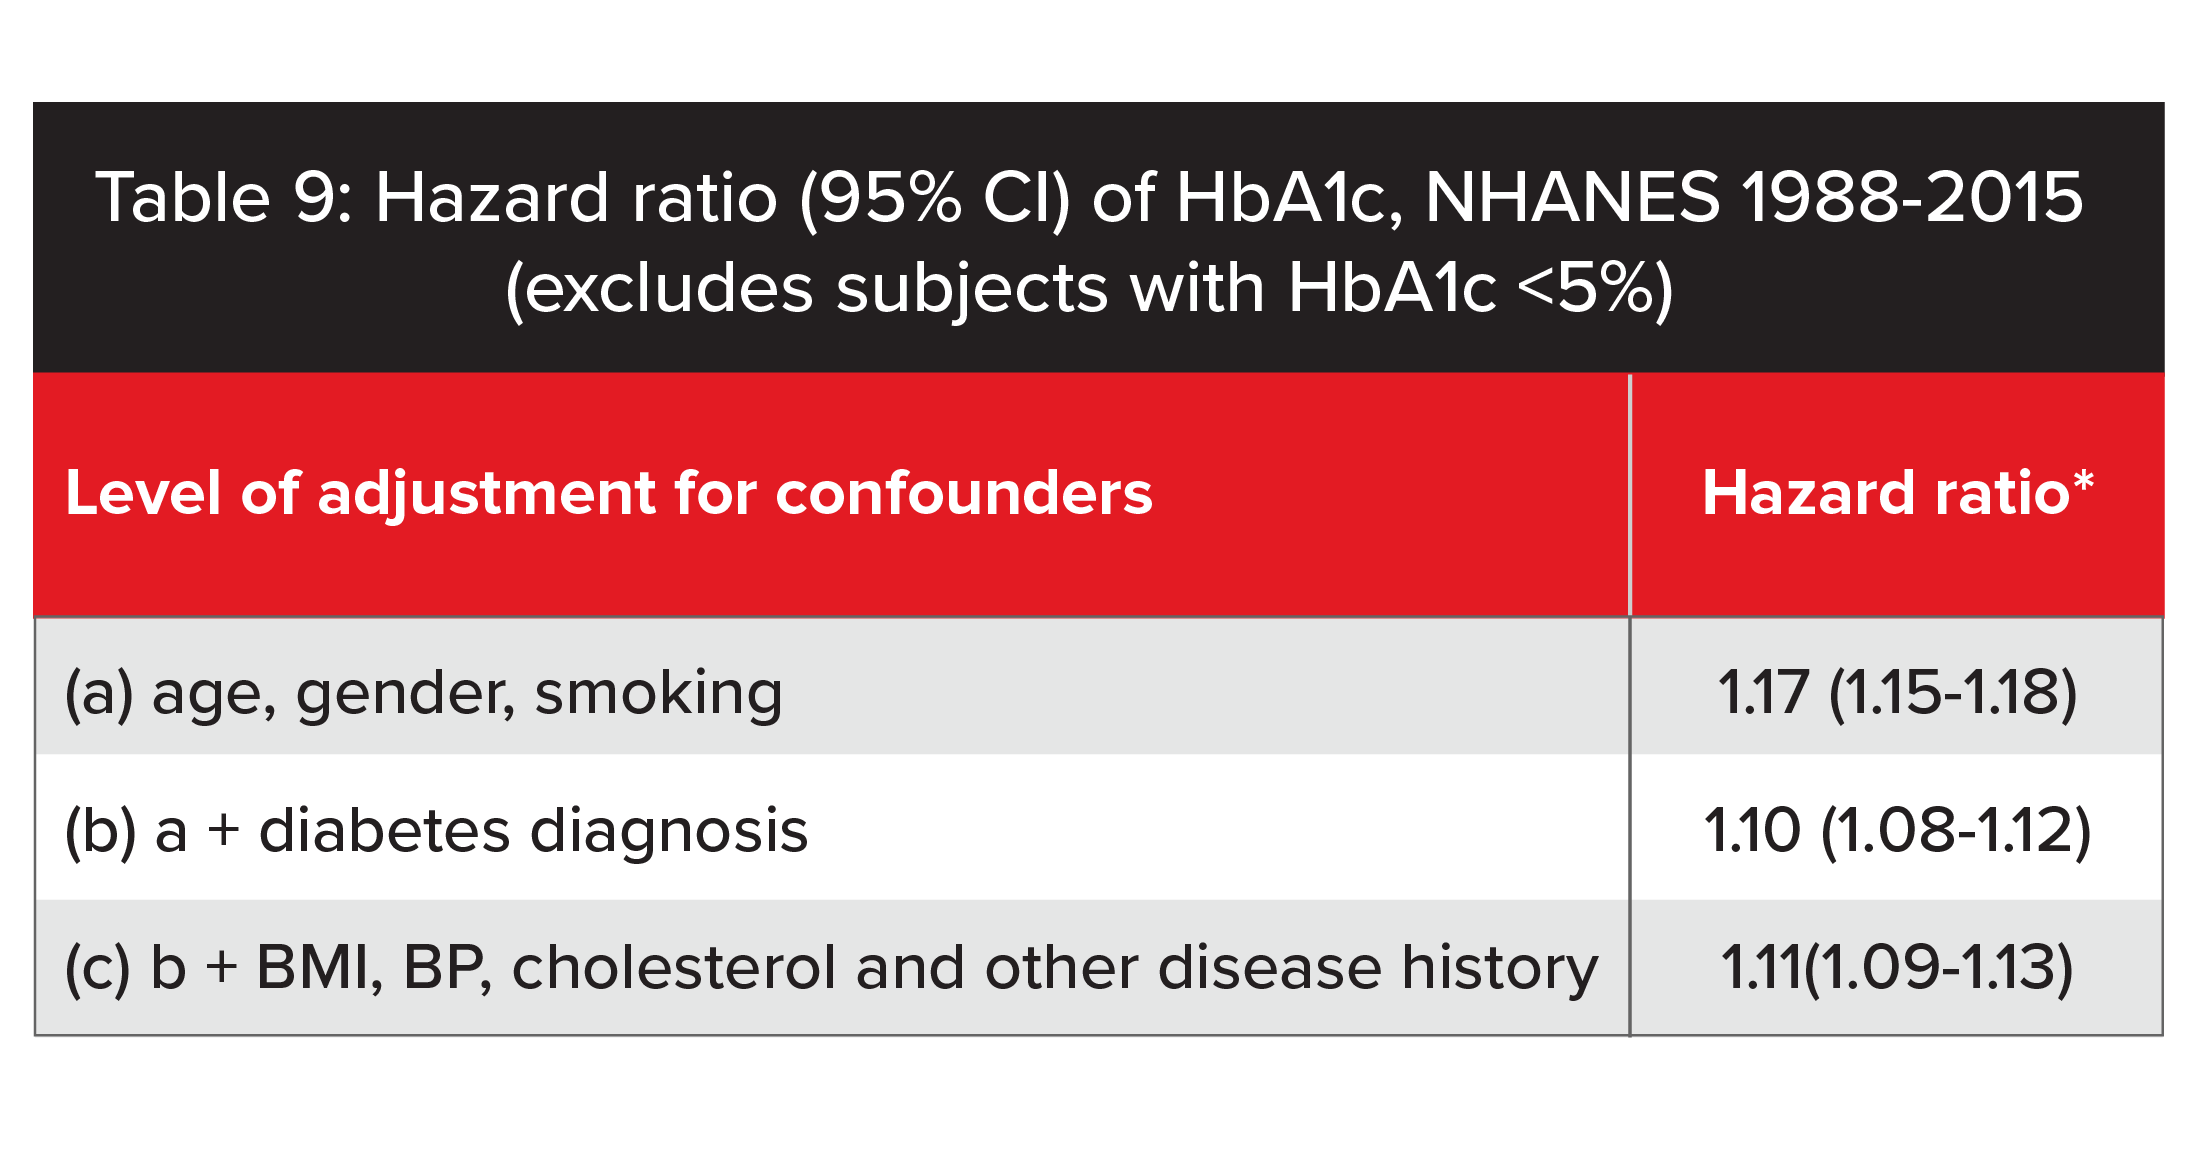
*Hazard ratio: Relative mortality increase for each 1% increase in absolute value of HbA1c while listed confounders held constant
It is also interesting to know the variation of hazard ratio by age and policy duration. In our analysis, hazard ratios decreased with increasing age, suggesting the protective value of HbA1c also decreases at older ages. In addition, we found, unlike most other underwriting risk factors, hazard ratios related to HbA1c did not “wear off” by duration (up to 27 years), suggesting a stronger long-term impact of HbA1c on mortality.
Underwriting Implications
Every additional piece of information has potential underwriting value. HbA1c results can help underwriters in several ways.
Although modern types of underwriting evidence, such as prescription records, health billings and electronic health reports, are increasingly becoming preferred evidence choices for underwriters, HbA1c testing will continue to play a role in detecting non- disclosure of diabetes or undiagnosed diabetes in the foreseeable future.
In terms of pre-diabetes, given it is prevalent in many parts of the world and most people are not aware they have it, HbA1c testing could help identify a significant proportion of such applicants. However, numerous studies suggest the mortality implications of pre- diabetes are limited. In our analysis of NHANES data, using the ADA’s cut-off range, we found the mortality elevation to be borderline significant (HR 1.05). It is important to note this finding only ap- plies to a non-diabetes population. In the context of underwriting, these HbA1c values represent people who have non-disclosed diabetes and pre-diabetes. Therefore, the overall hazard ratio will be higher. To better assess the mortality risk, it remains important to seek evidence of diagnosis.
Pre-diabetes is more likely to be of underwriting significance when associated with insulin resistance syndrome or metabolic syndrome. Holistic risk assessment involves taking into account borderline raised HbA1c levels in the context of other cardiovascular risk factors such as obesity, adverse waist-to-hip ratio, increased waist circumference, hypertension, hyperlipidemia, low HDL or hypertriglyceridemia. In our analysis using a multivariate Cox model, we found HbA1c levels, systolic blood pressure and BMI all have their own independent impacts on mortality. This supports the idea that the combined mortality impact would be stronger than for each risk factor alone.
Consistent with many other earlier studies, we also found a low HbA1c test result (< 5%) is associated with elevated mortality. The reason for the correlation between low HbA1c and higher mortality is unclear; more studies are needed to better understand the cause. When assessing an applicant with low HbA1c, it is important for underwriters to consider the possibility of serious underlying causes, including liver disease and blood disorders such as thalassemia major, spherocytosis and aplastic anemia. In the absence of any obvious cause, and assuming a well-documented medical history is available, a cautious approach is suggested, given potential mortality implications at these low levels.
HbA1c: Still Hitting That Sweet Spot
The literature review and our analysis confirmed HbA1c testing is indeed a useful blood test for mortality risk assessment. From a mortality perspective, our analysis shows that even after adjusting for commonly recognized confounding factors, mortality increases by 11% for each 1% increase in HbA1c, after excluding subjects with HbA1c < 5%.
While HbA1c is used to detect non-disclosure of diabetes and undiagnosed diabetes, it can also play a role in assessing pre-diabetes. In addition, low HbA1c levels can alert underwriters about the possibility of serious underlying disorders.
HbA1c testing has potential value as a mortality biomarker. When used selectively, HbA1c testing remains a useful tool in an underwriter’s armory and continues to provide good value.


